
示例 CSV
| Month | Average Rainfall (mm) |
|---|---|
| Jan | 146 |
| Feb | 109 |
| Mar | 97 |
| Apr | 66 |
| May | 44 |
| Jun | 39 |
| Jul | 18 |
| Aug | 25 |
| Sep | 41 |
| Oct | 88 |
| Nov | 158 |
| Dec | 152 |
A step by step walkthrough for turning a spreadsheet of cyclical categories into a published polar area chart in PlotSet, from shaping the sheet to adding a scale and exporting the finished rose.
约 8 分钟A spreadsheet of months, hours or compass directions is the starting point for how to create a polar area chart in PlotSet, ending with a published circular chart that carries a real scale, not just a decorative rose. Not a screenshot of someone else's rose chart, your own data, run through the same click path a PlotSet chart takes from upload to publish.
If your spreadsheet is already two columns, category and value, in the order you want them to appear around the circle, this takes about eight minutes. Add another five if you're reordering a report that came out sorted by value, or renaming months so they match a calendar year instead of a fiscal one. Budget the eight minutes below and treat the rest as a buffer.
Two columns, one row per sector, listed in the order you want them to appear around the circle. Category first, number second, one header row. No totals row, no sorting by value.
| Month | Average Rainfall (mm) |
|---|---|
| Jan | 146 |
| Feb | 109 |
| Mar | 97 |
| Apr | 66 |
| May | 44 |
| Jun | 39 |
| Jul | 18 |
| Aug | 25 |
| Sep | 41 |
| Oct | 88 |
| Nov | 158 |
| Dec | 152 |
List categories in the order they should sit around the circle. PlotSet places rows starting near the top and moving clockwise, so a resorted or alphabetized sheet breaks a cycle like the calendar.
Keep the value column free of negative numbers. A polar area chart has no direction below the centre to draw a sector in, so a negative value either gets clipped or throws off the whole scale.
Delete any totals or subtotals row before uploading. A stray "Total" row becomes a sector of its own, usually the longest one, and it wrecks the radial scale for every other category.
Blank cells in the value column render as a zero-length sector rather than being skipped. Fill them in or remove the row before you upload.
PlotSet 中从空白模板到完成图表的具体点击路径。
From the PlotSet dashboard, start a new project and choose the Polar Area Chart template (listed as the radial polar bar template in the library). It loads with twelve sample sectors already in place, so you can see the column layout before swapping in your own file.

Category in the first column, its number in the second, one row per sector. Order the rows the way you want them to read around the circle: January through December, midnight through 11pm, or north through northwest. PlotSet plots rows in sheet order; it does not infer a calendar or a clock face for you.
Import a CSV or .xlsx file from the data panel, paste rows straight from a spreadsheet, or connect a Google Sheet if you want the chart to update later without a re-upload. PlotSet reads the first row as headers automatically.

Confirm which column feeds the angular position and which feeds the radius. This is usually automatic when your headers are clear, but worth checking manually if your sheet carries extra columns PlotSet had to guess at.

Unlike a bar chart, resist switching this to sort by value. Sorting breaks the cycle you built into the row order, putting December next to July instead of January. If your categories genuinely have no natural order, a bar chart will serve the comparison better than forcing them into a circle.
Add the concentric rings and label at least two of them with real values. Without a visible scale, a reader can see which sector is biggest but has no way to convert a radius into a number, and the chart stops doing a chart's job.
A single series gets one consistent colour, same reasoning as a bar chart: colour isn't carrying any information here. Turn on labels at the outer edge of each sector so the exact value is readable without measuring against the rings, since the area exaggerates differences more than a straight bar would.
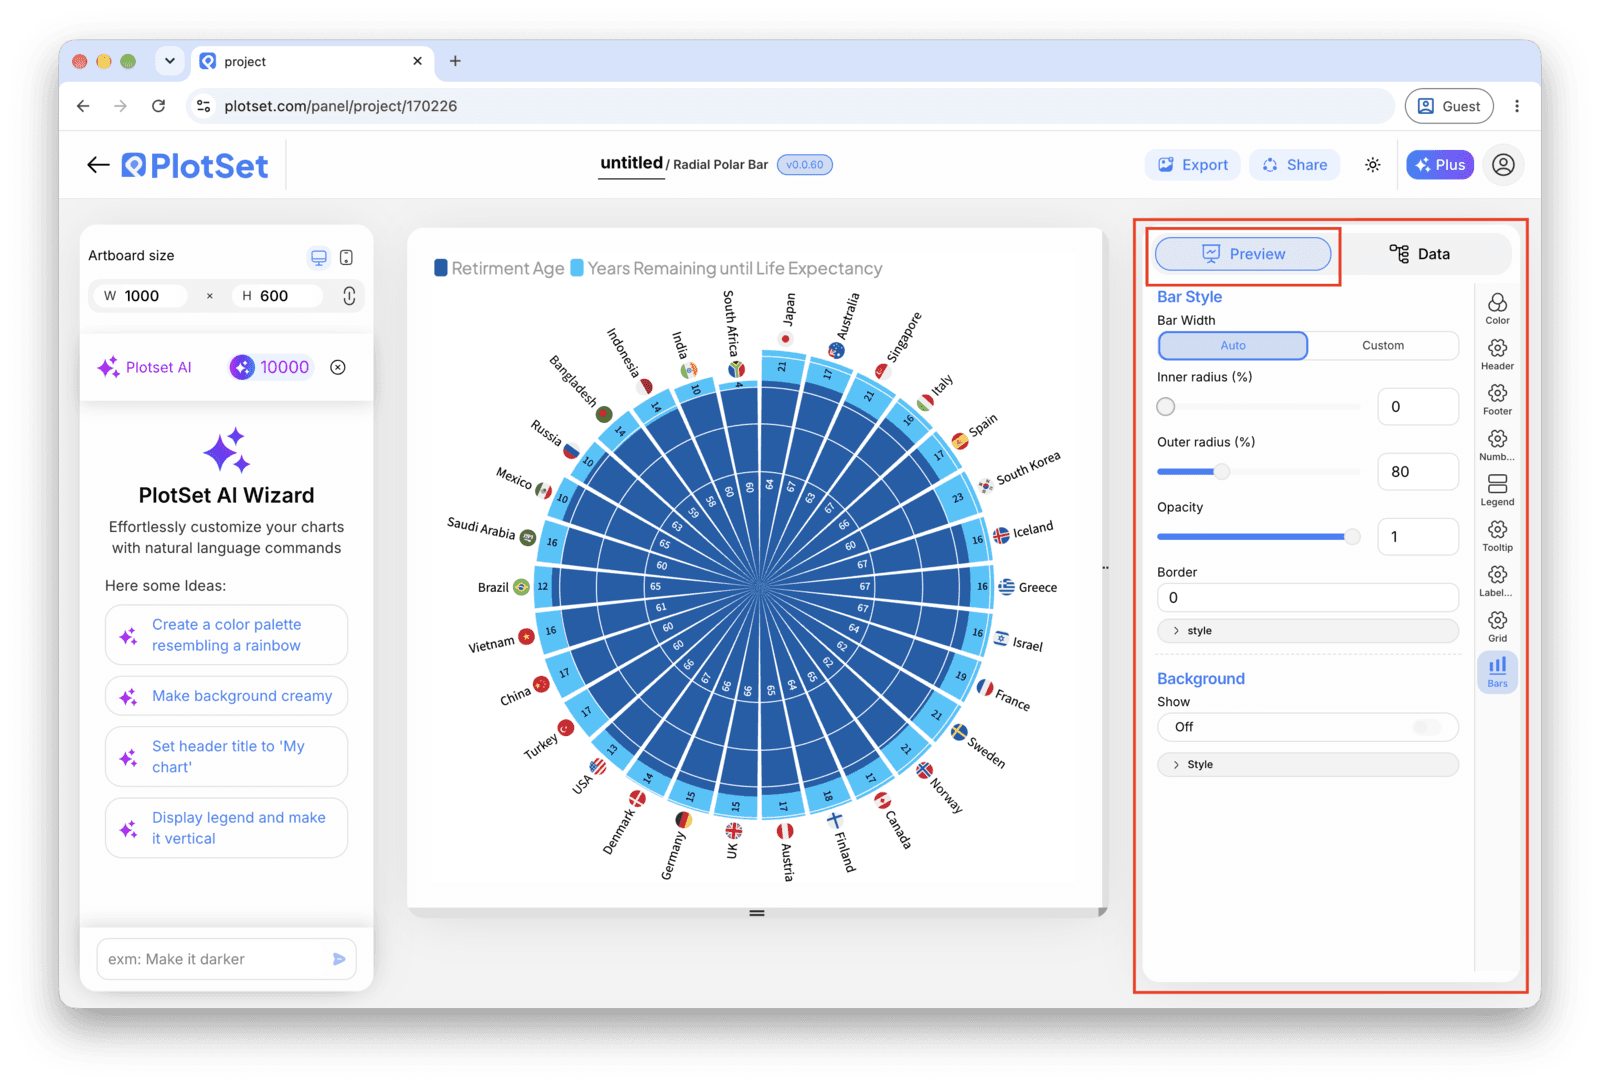
Publish for a live interactive chart with hover tooltips and a shareable link, grab the embed code to drop it into a page, or export a PNG, SVG or PDF if you need a static image for a deck or report.
从已加载示例数据的 Polar Area Chart 模板开始,再替换成你自己的数据。
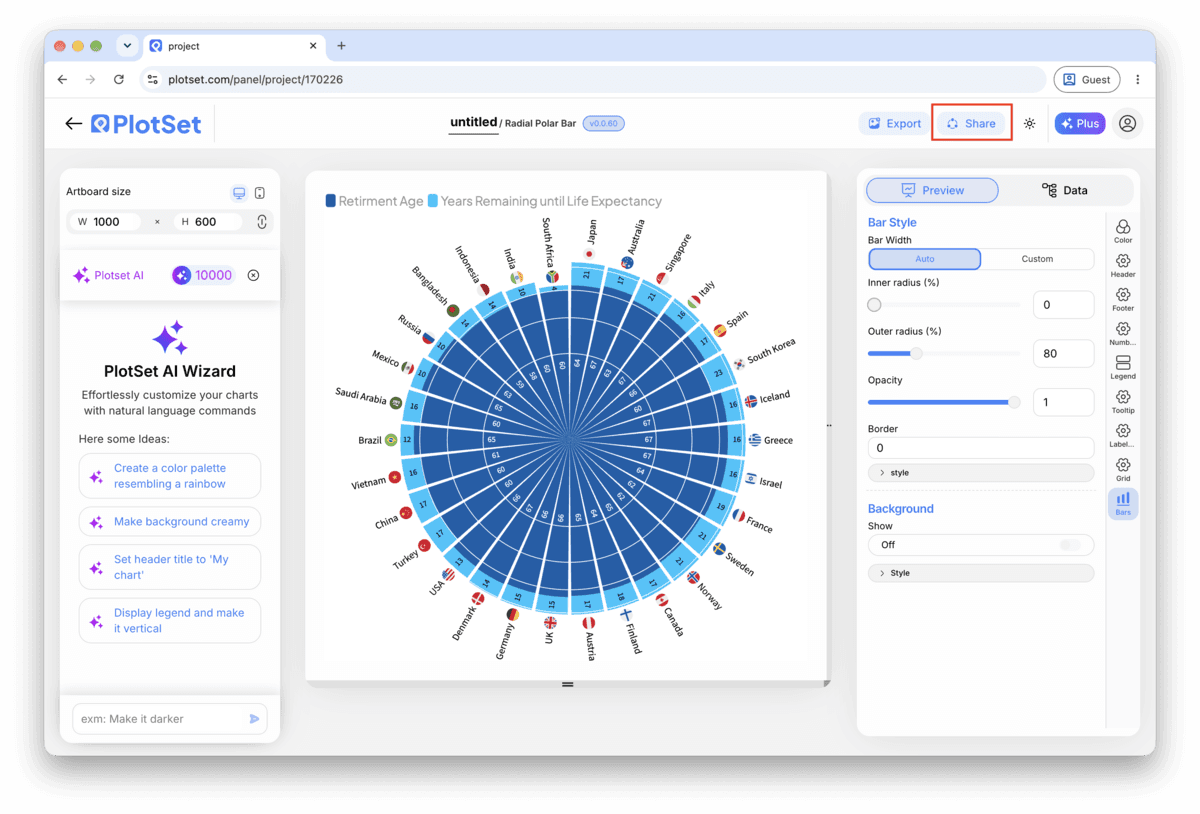
打开模板最后一段路对每种图表都一样:「Share」(分享)把图表变成一个在线的公开链接和一段嵌入代码,「Export」(导出)把它输出成静态文件。
打开嵌入代码和公开链接的开关,图表就发布出去了。链接可以放心发给任何人;嵌入代码以 iframe 的形式放进任意页面,悬停提示和交互效果都会保留。之后修改了图表,点「Recreate」就能把改动同步到链接和嵌入代码两边。

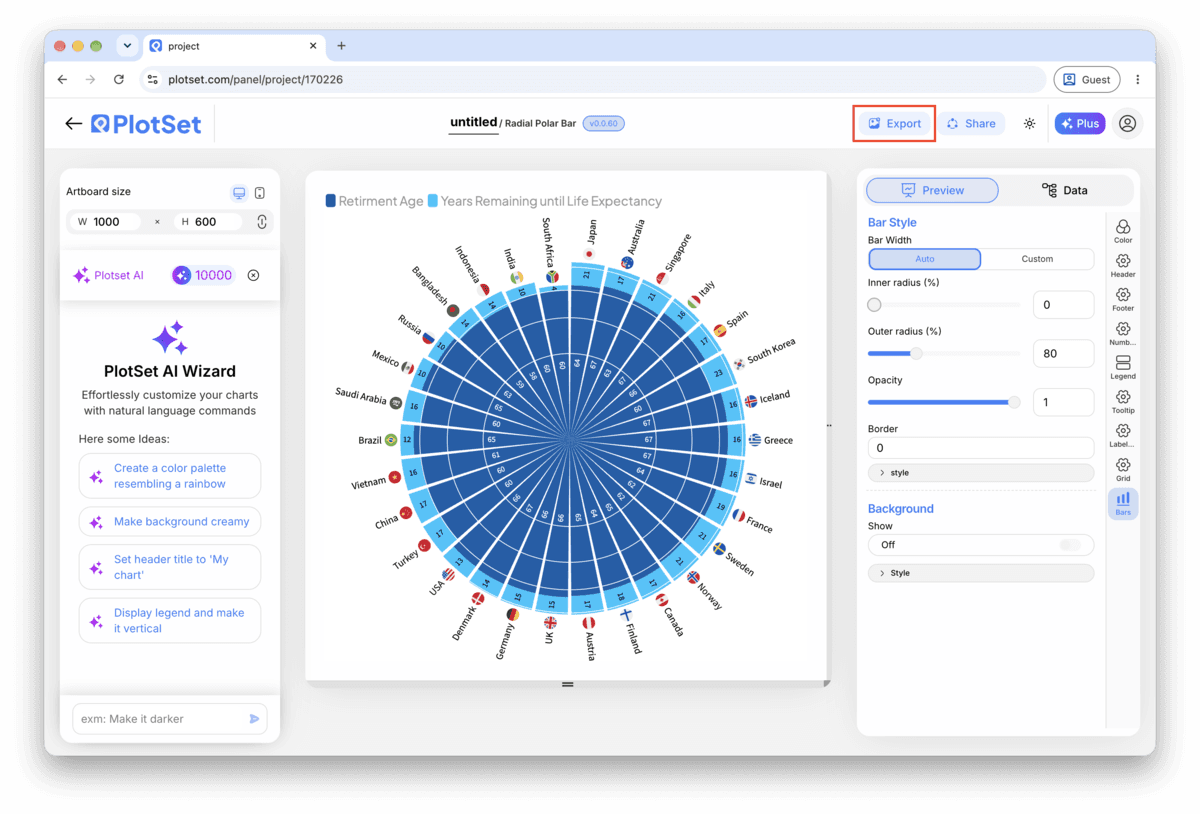
「Export」会按你需要的尺寸输出一份静态副本。SVG 放到多大都清晰,还能在设计工具里继续编辑;幻灯片和文档用 PNG 或 JPG 最稳妥。想让图片在高分屏上够锐利,关键就是那个倍数设置。

Months, hours, compass directions, days of the week. If your categories don't have a natural loop, the circle implies a relationship between neighbours that isn't real, and a sorted bar chart will tell the same story more clearly.
Twelve months work well because each label still has room to breathe. Past about a dozen sectors, labels start colliding at the outer edge, and the rose turns into a solid blob near the centre where the radii sit close together.
Radius is the encoding here, exactly like a bar's length is the encoding on a bar chart. A truncated scale exaggerates every sector, and since area already grows faster than radius, a non-zero start compounds the distortion instead of fixing anything.
Because area scales with the square of the radius, two sectors that differ by twenty percent in value can look twice as different by eye. Turn on value labels so the reader isn't left estimating from the picture alone.
This is usually the sort control defaulting to descending, the same setting that helps a bar chart and ruins a polar area chart. Open the sort setting in the chart settings and switch it back to the sheet's own row order.
This means the radial gridlines are off or unlabeled. Turn them on and label at least two rings with real numbers, otherwise the circle is decoration, not a chart.
Usually too many sectors for the space; past about fifteen categories the labels start colliding no matter how the chart is sized. Group the smallest categories into an "Other" sector, or move to a bar chart if every category needs its own visible label.
不确定 Polar Area Chart 是否是正确选择?查看它是什么、何时使用以及何时不使用。
Two columns and one header row: category names in the first column, one number per category in the second, listed in the order you want them to appear around the circle. CSV and .xlsx both work, and a pasted range from any spreadsheet tool is fine too.
免费开始,300+ 模板任选。无需信用卡。