
示例 CSV
| Metric | Value |
|---|---|
| Trees planted | 1284500 |
| Volunteers | 18430 |
| Countries reached | 64 |
| Schools supported | 1207 |
A step by step walkthrough for building an animated counter in PlotSet, for one headline figure or a grid of statistics, with an embed code you can paste anywhere.
约 5 分钟You will end up with a large number that counts up to its value when the page loads, with an optional prefix, suffix and caption.
Expect about five minutes. A single figure takes two, and a grid of statistics takes a little longer.
For a single figure no data is needed. For a grid, one row per statistic with a label and a value.
| Metric | Value |
|---|---|
| Trees planted | 1284500 |
| Volunteers | 18430 |
| Countries reached | 64 |
| Schools supported | 1207 |
The value column is read as a number.
The label column becomes the caption under each counter.
In Single mode you can type the number in the settings and leave the sheet alone.
Write numbers without thousands separators in the sheet. The ticker adds them.
PlotSet 中从空白模板到完成图表的具体点击路径。
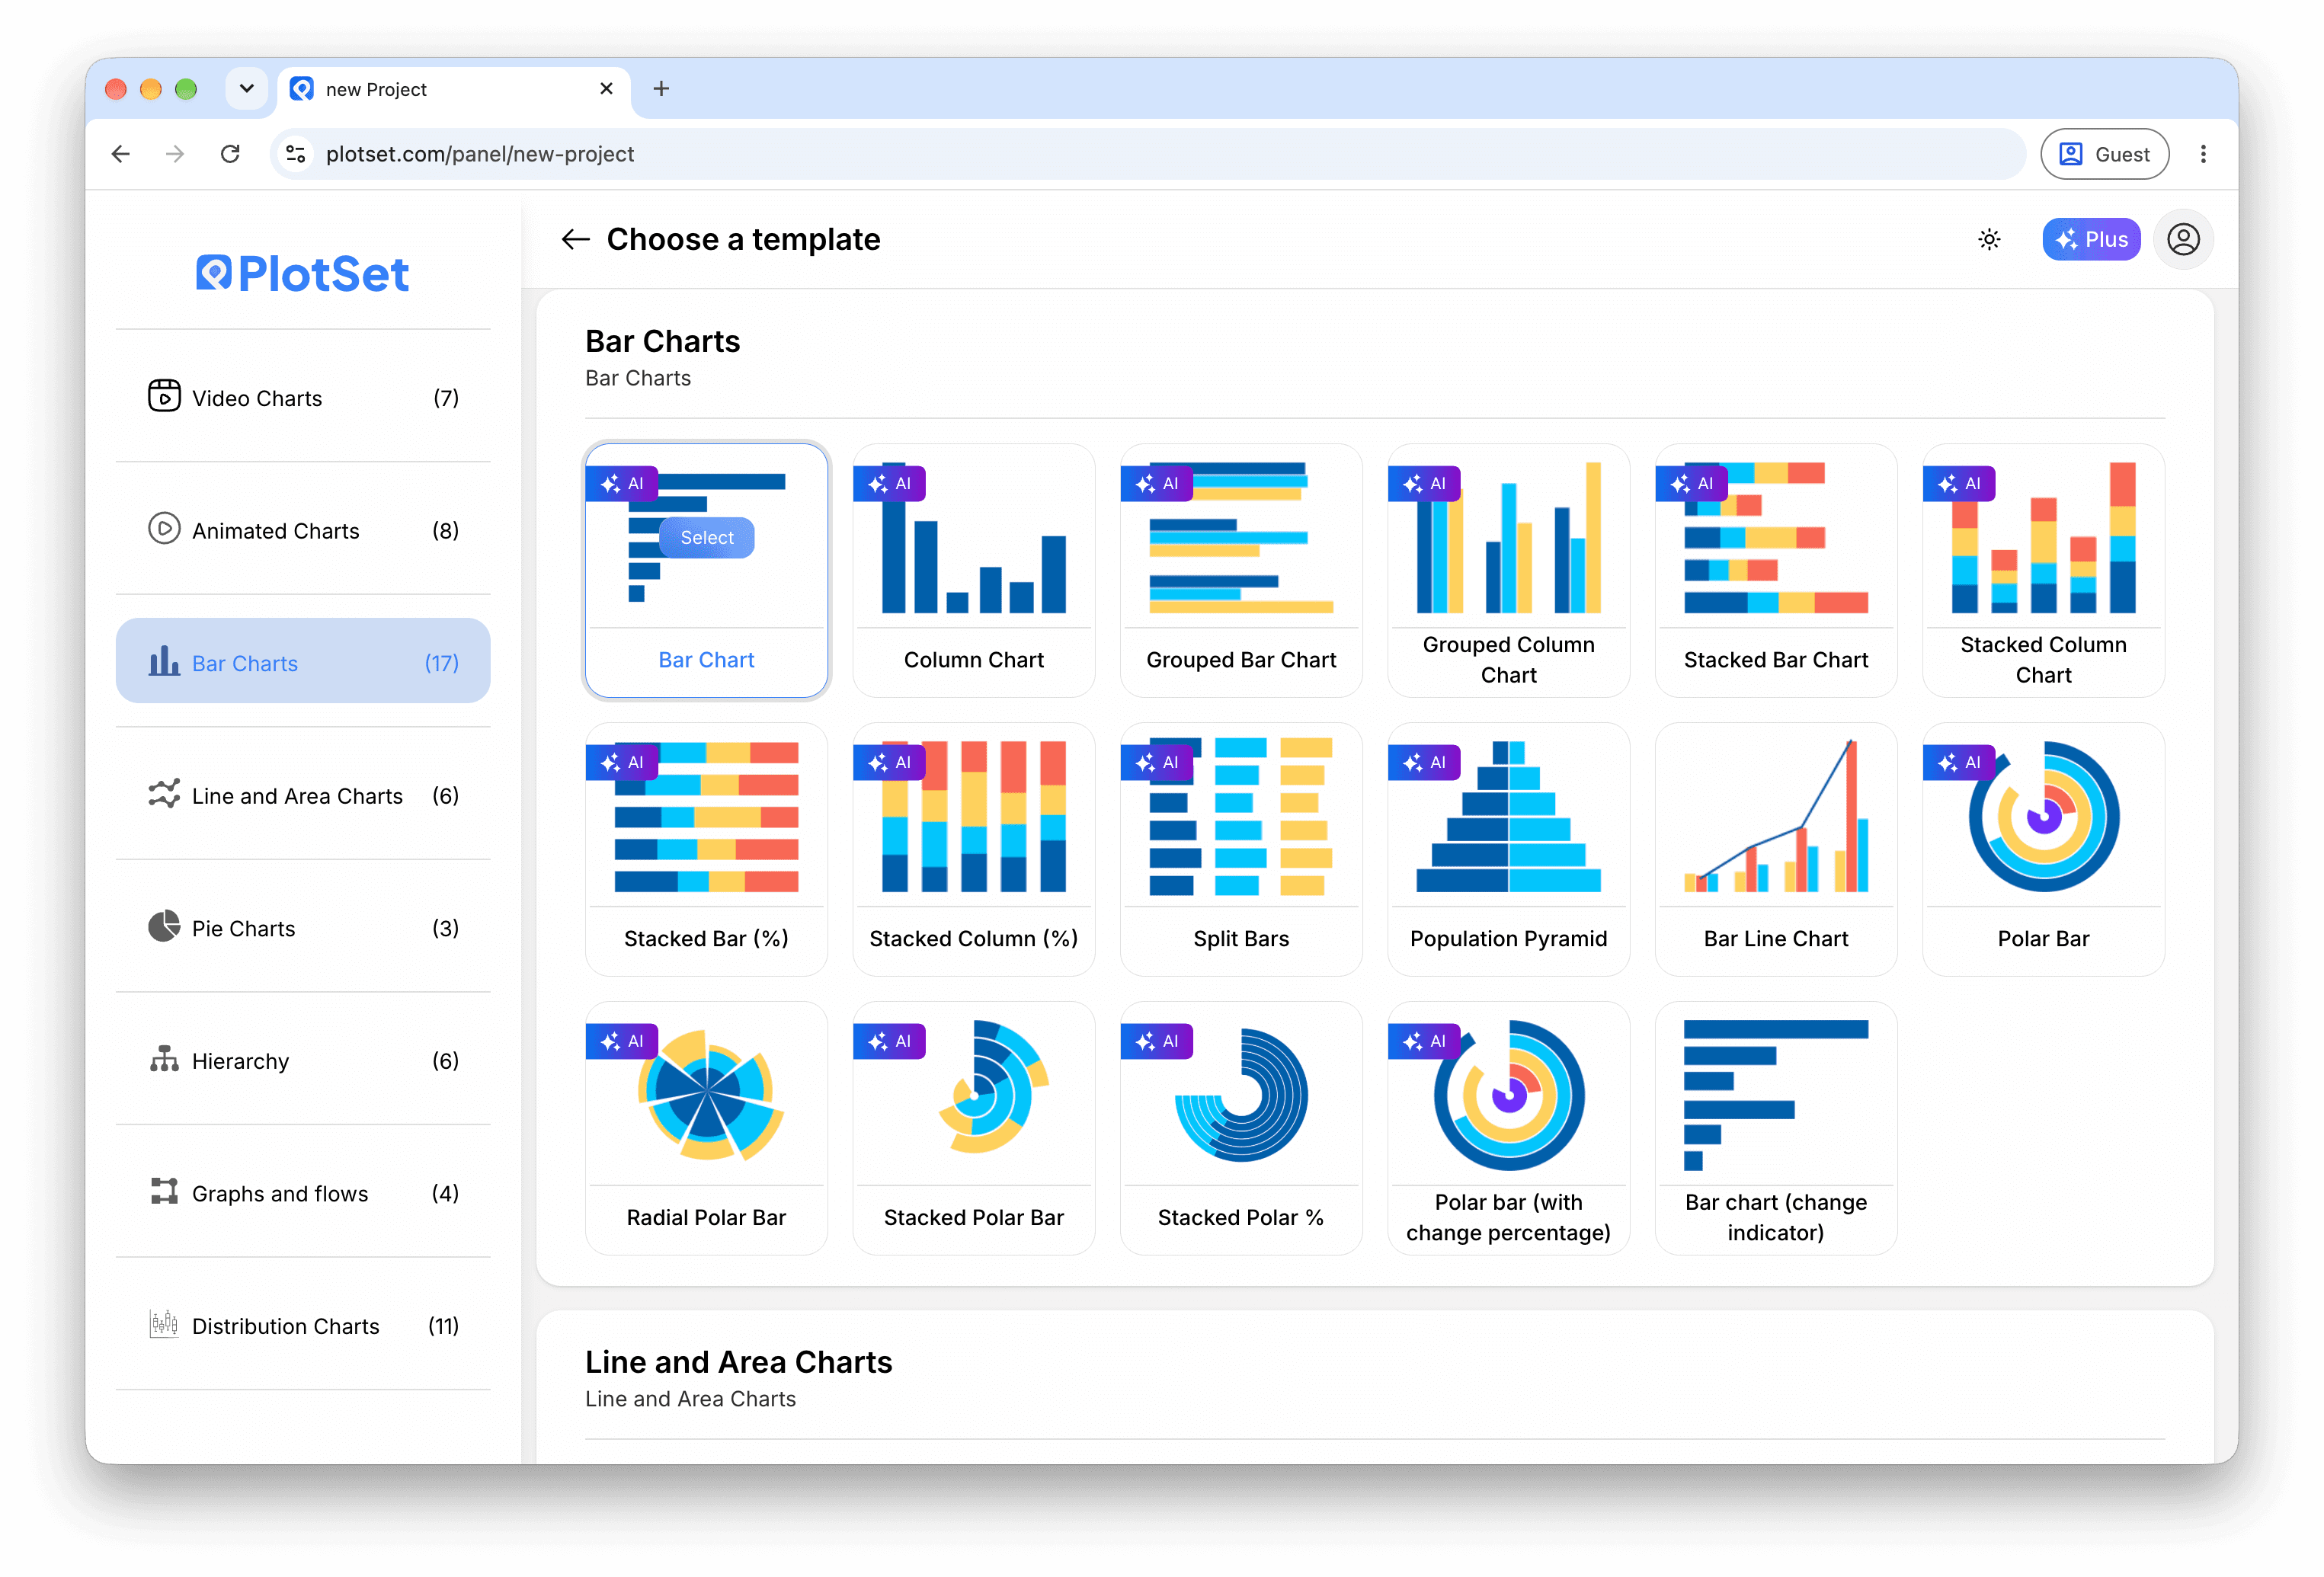
From the PlotSet dashboard, start a new project and search for Number Ticker. It opens with a single counter that counts up to 1000.
In the Value tab, choose Single for one number, Template for text with numbers inside it, or From data for a counter per row.
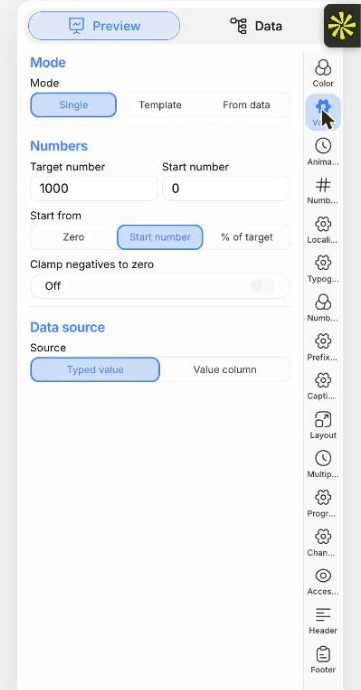
In Single mode, type the target and the start number. In From data mode, paste rows or import a CSV or .xlsx file.
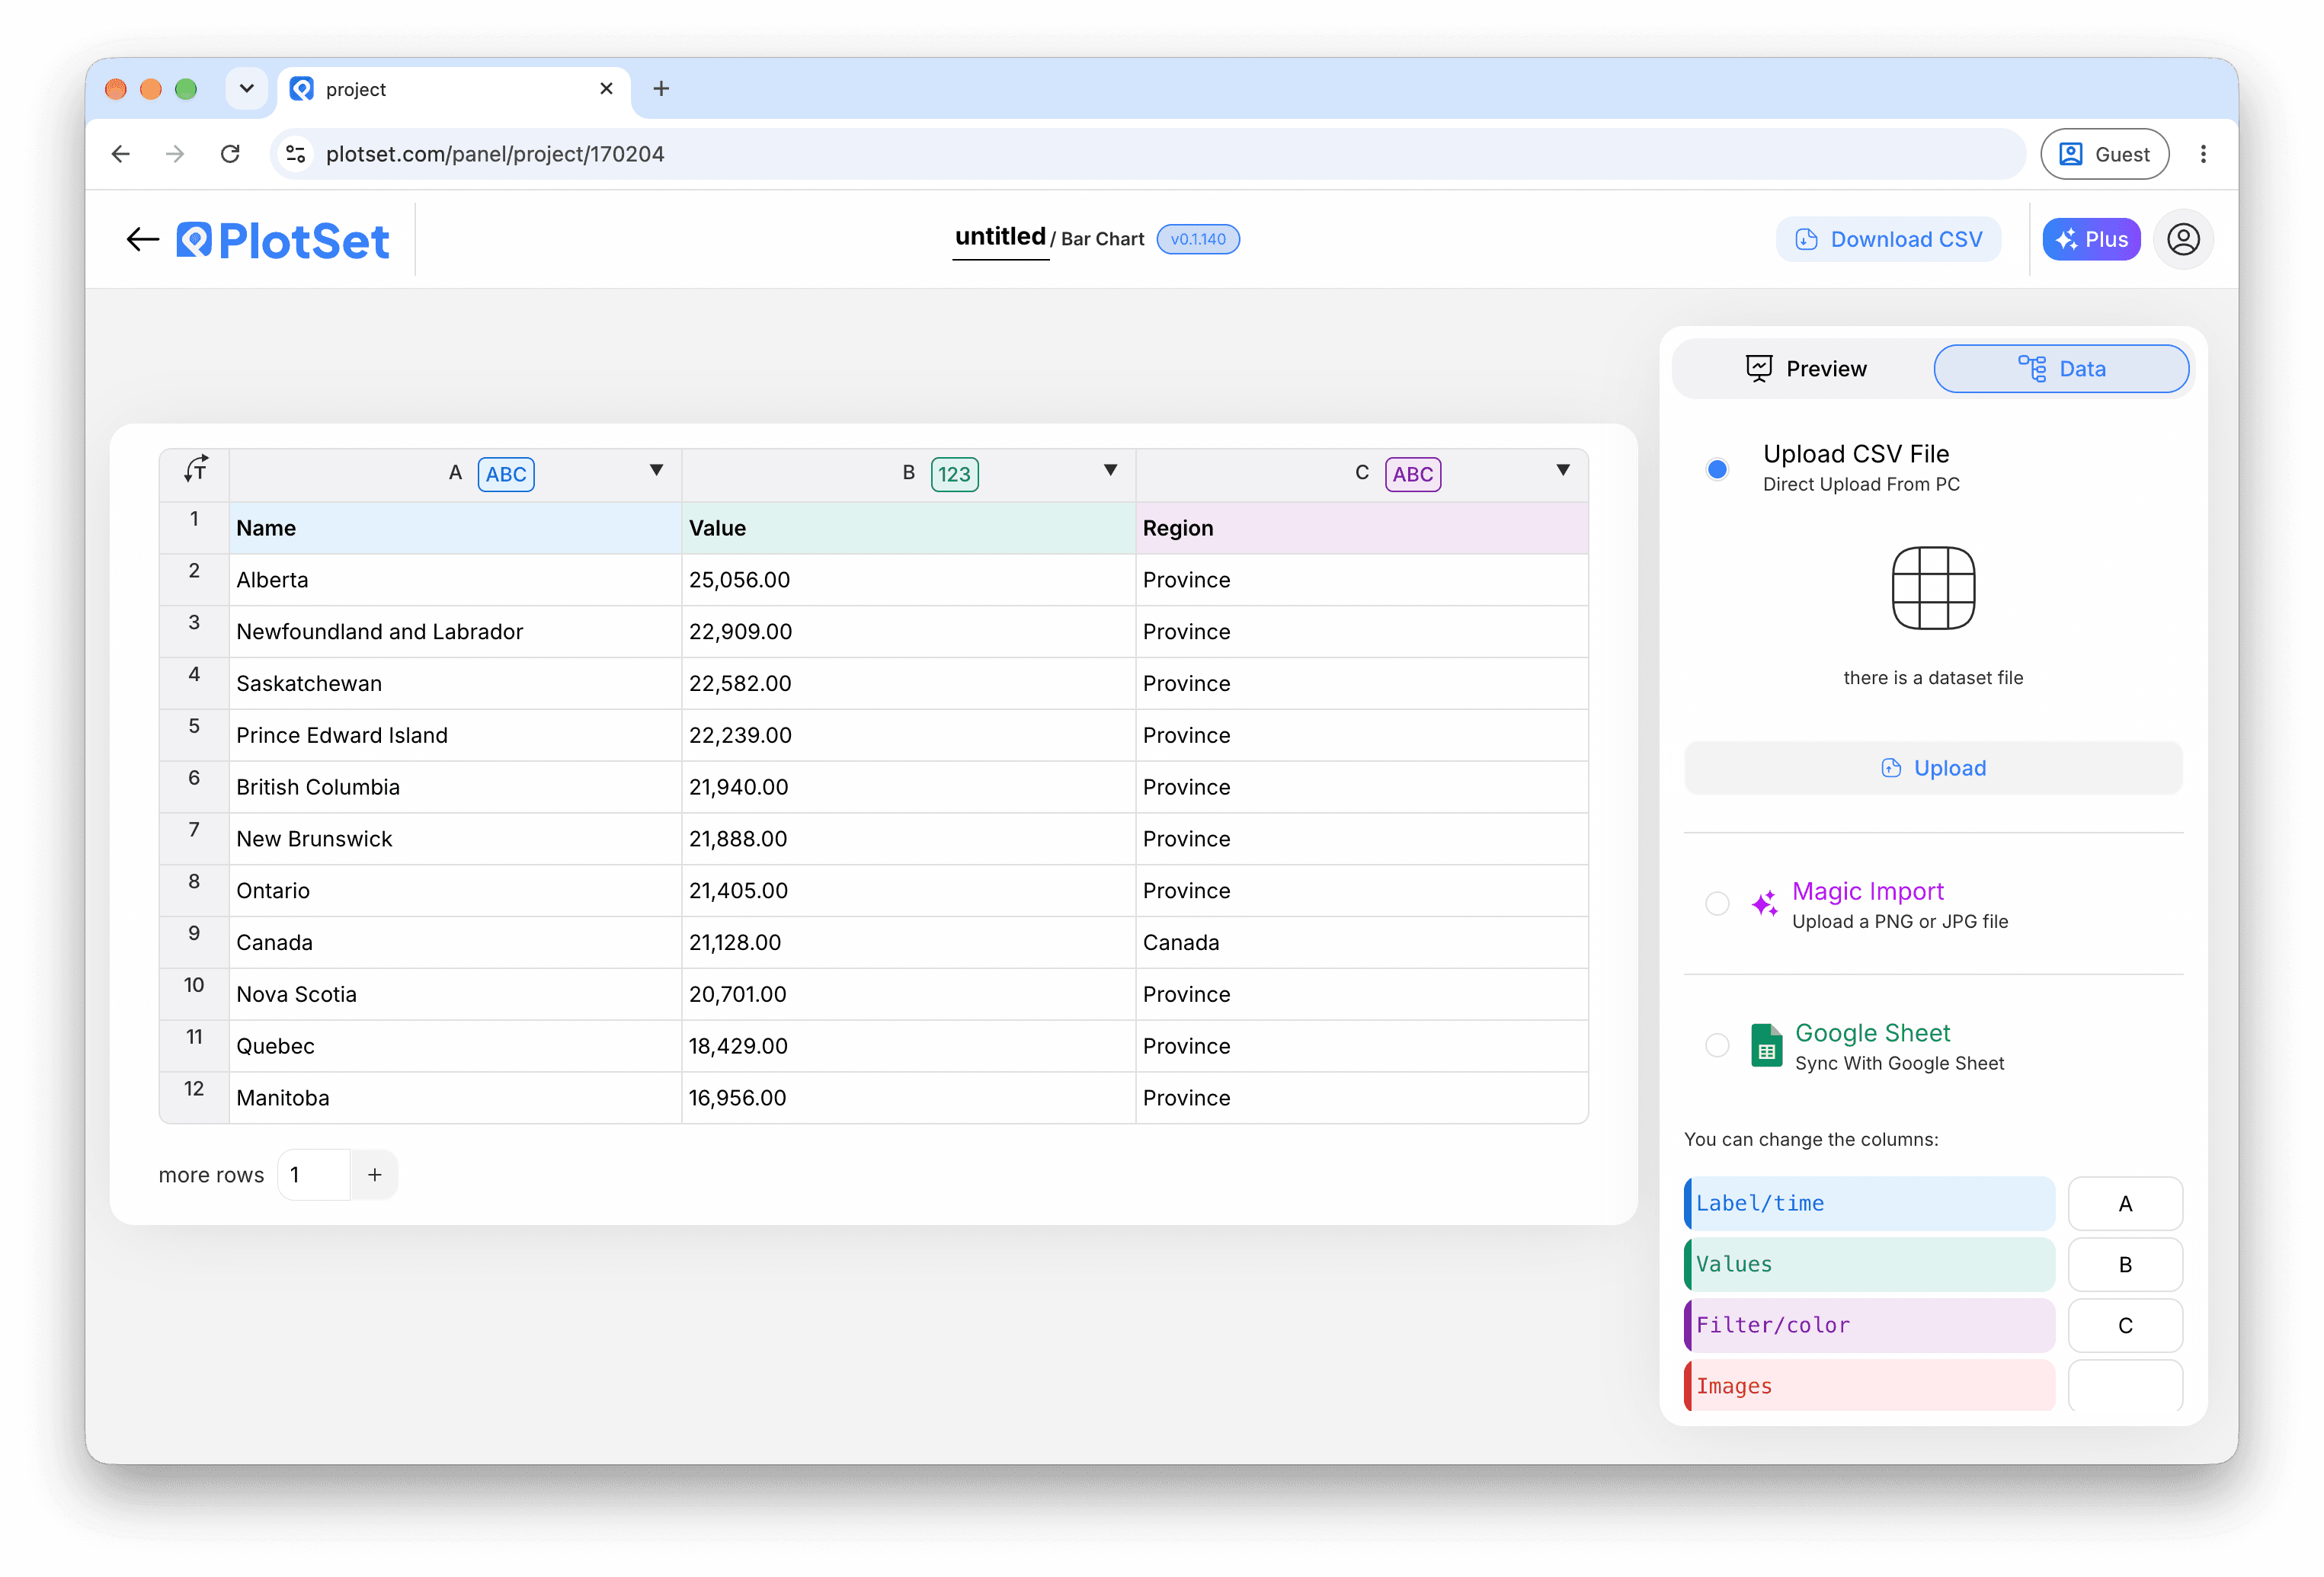
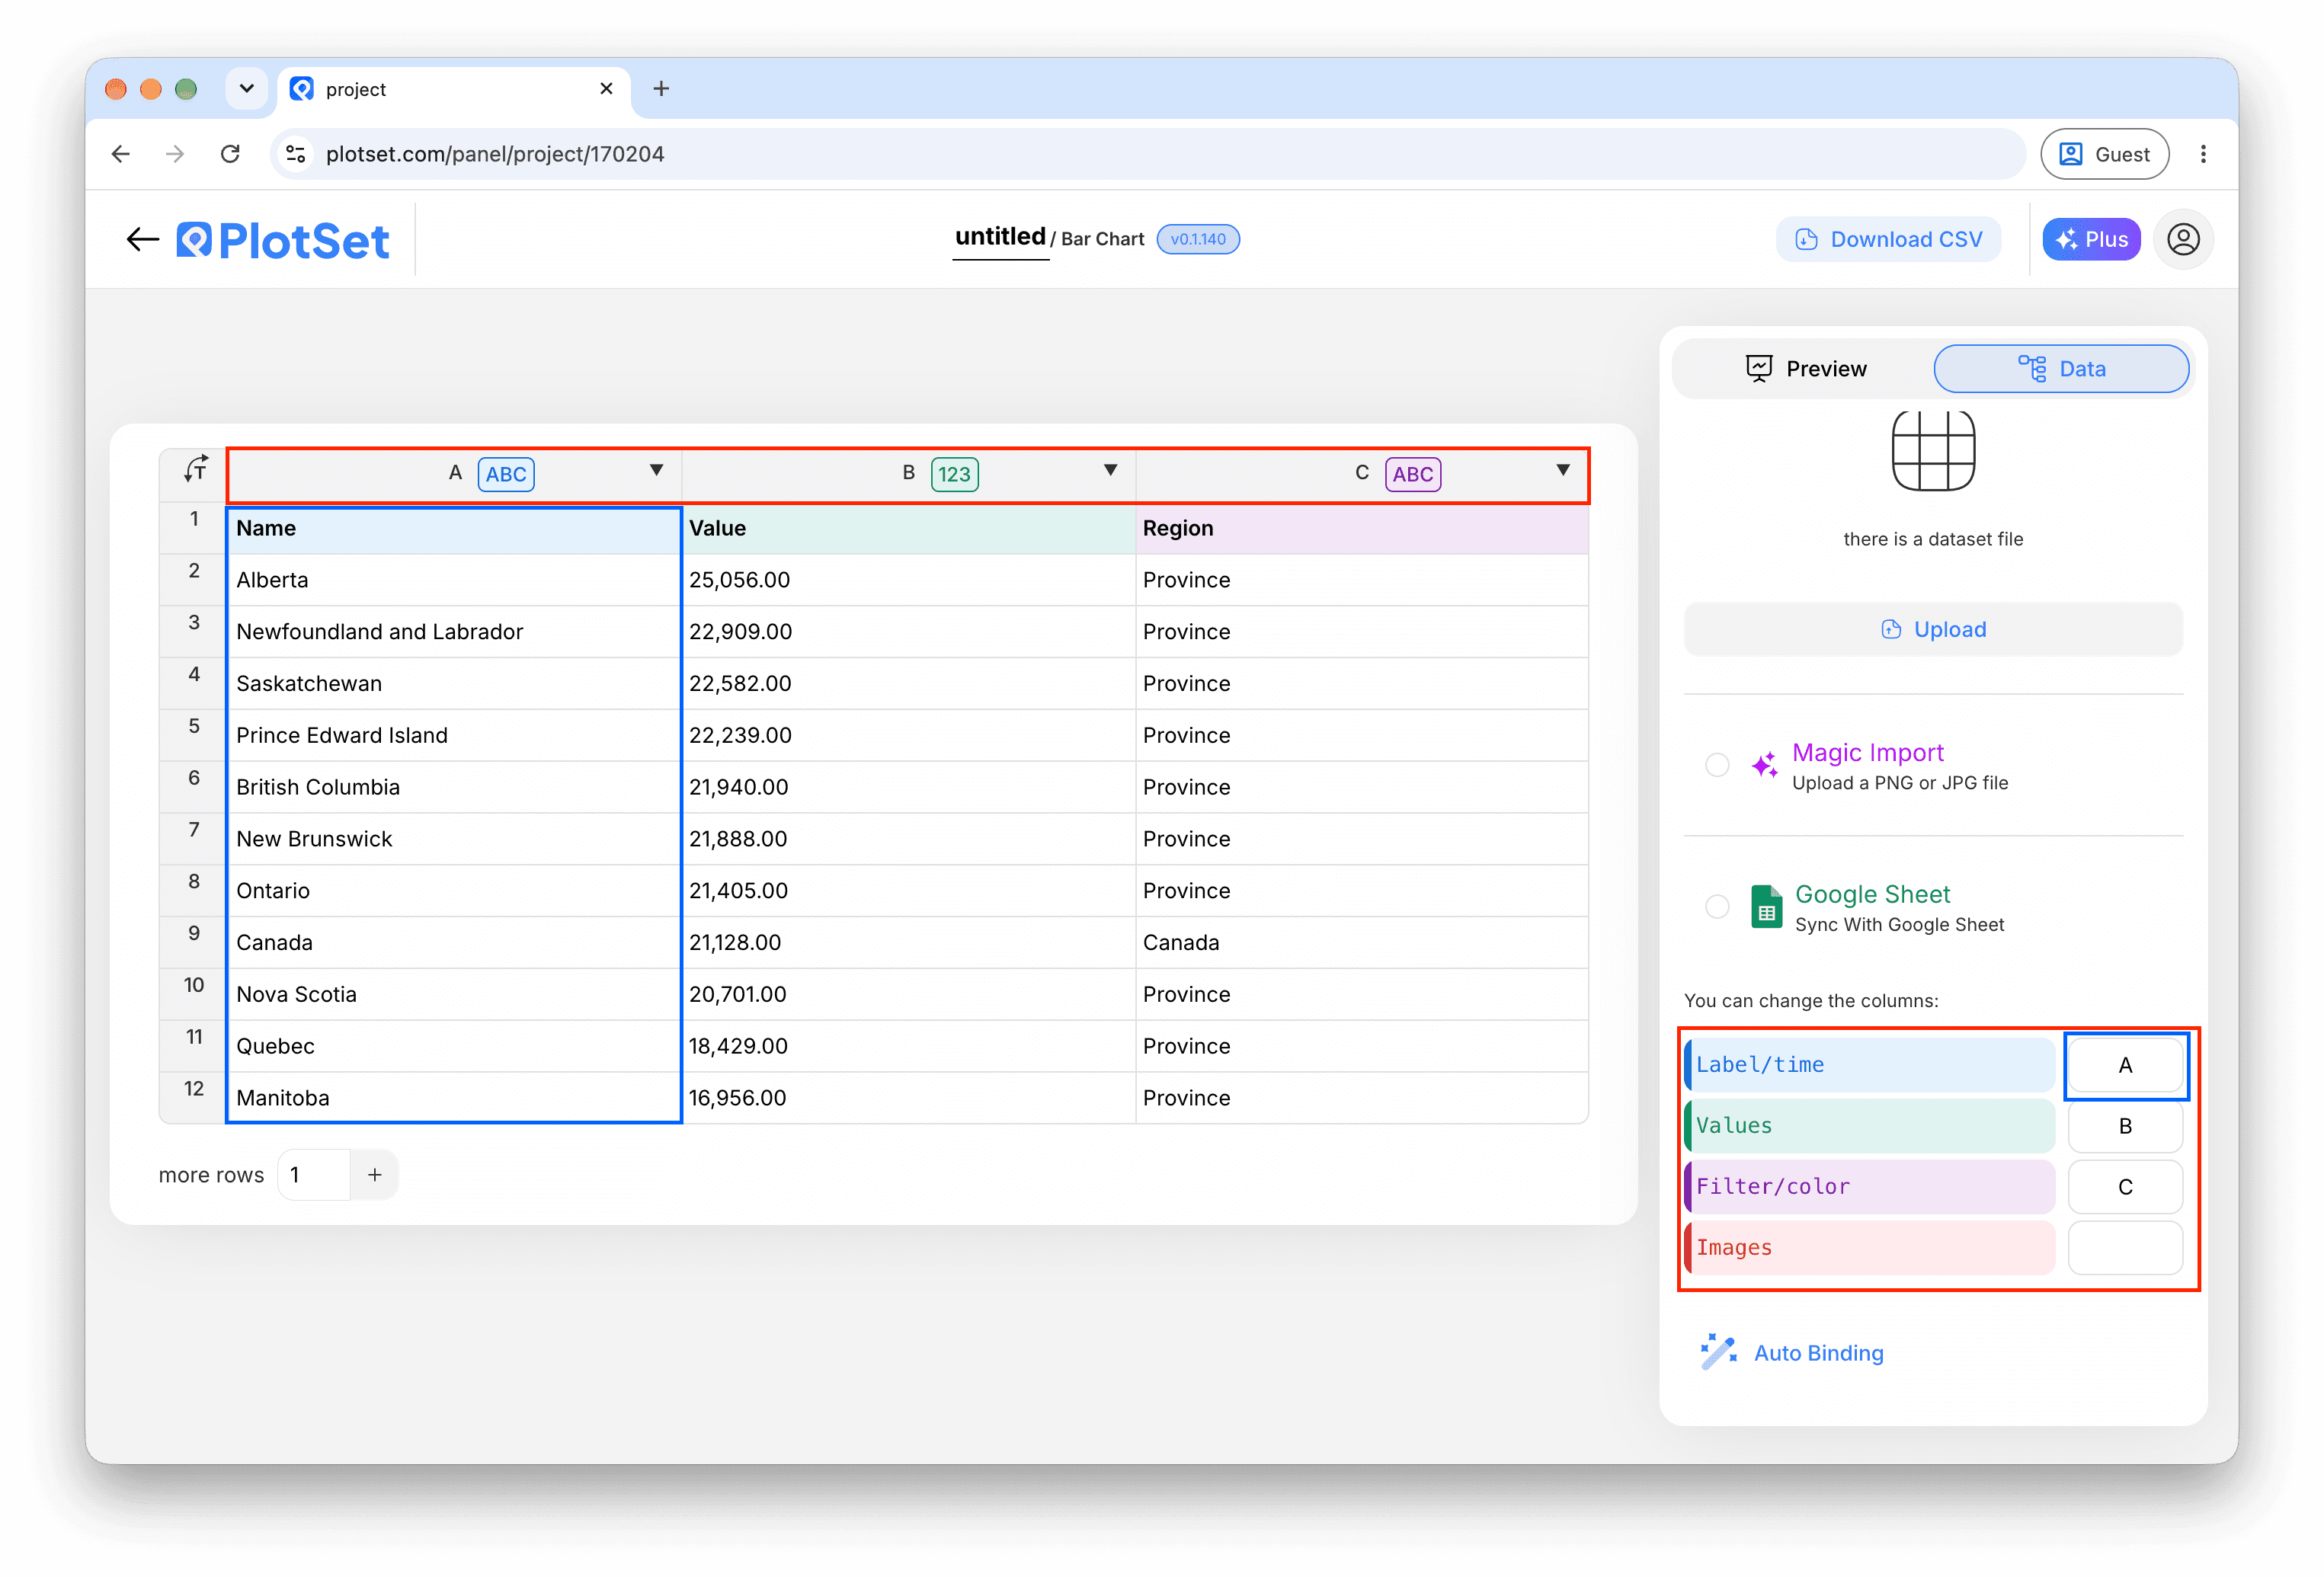
Bind the value column to Value and the label column to Label. In Single mode with a typed value, you can skip this.
In the Number format tab, add a prefix or suffix, set the decimals and choose the grouping, or abbreviate large numbers.
In the Animation tab, set the duration and easing, and choose whether the count repeats or runs once.
The Typography and Number color tabs set the font, the size and the colour, including a gradient or a colour that changes with progress.
Publish for a live chart and copy the embed code from the Share dialog. Reload the page to watch the count run.
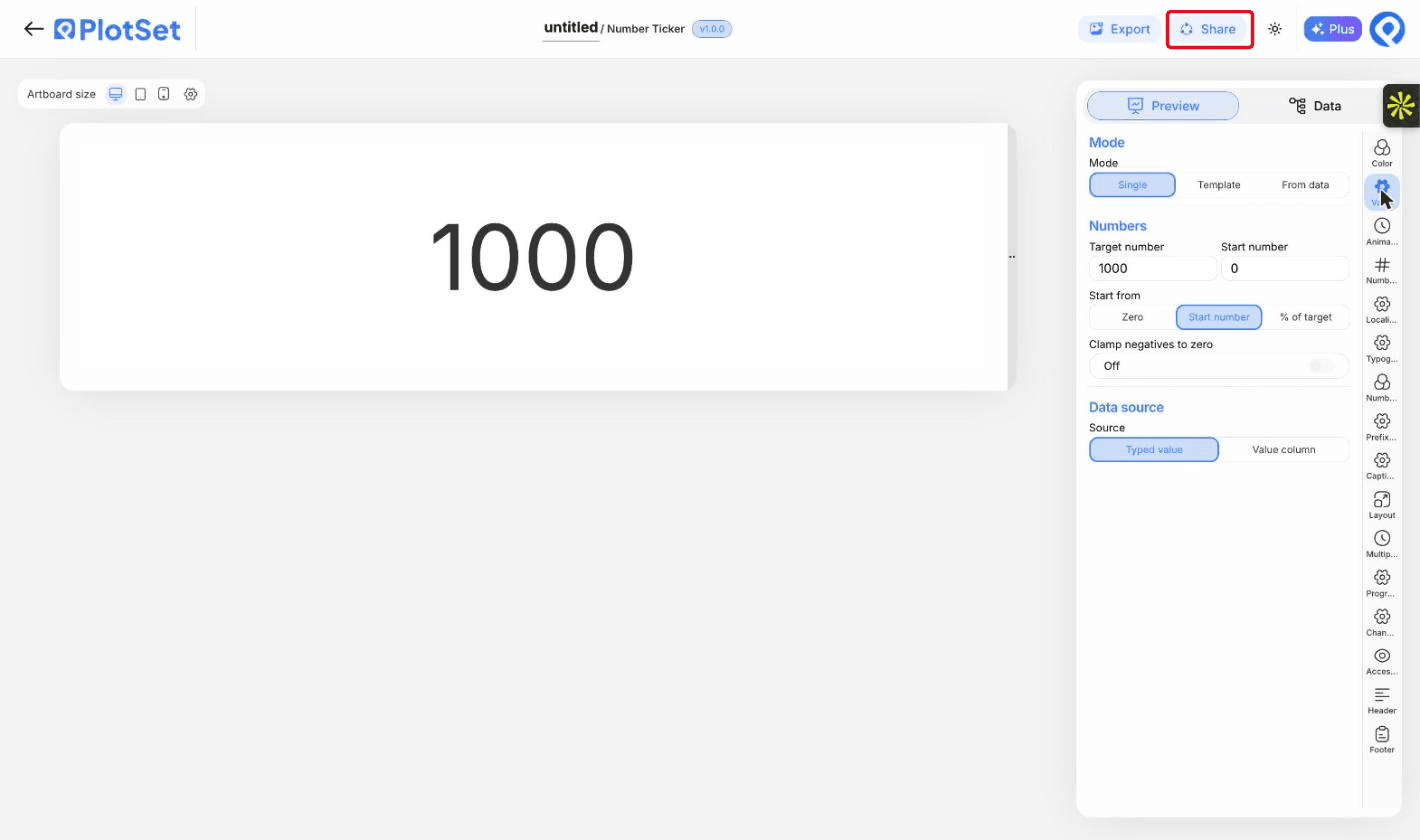
从已加载示例数据的 Number Ticker 模板开始,再替换成你自己的数据。
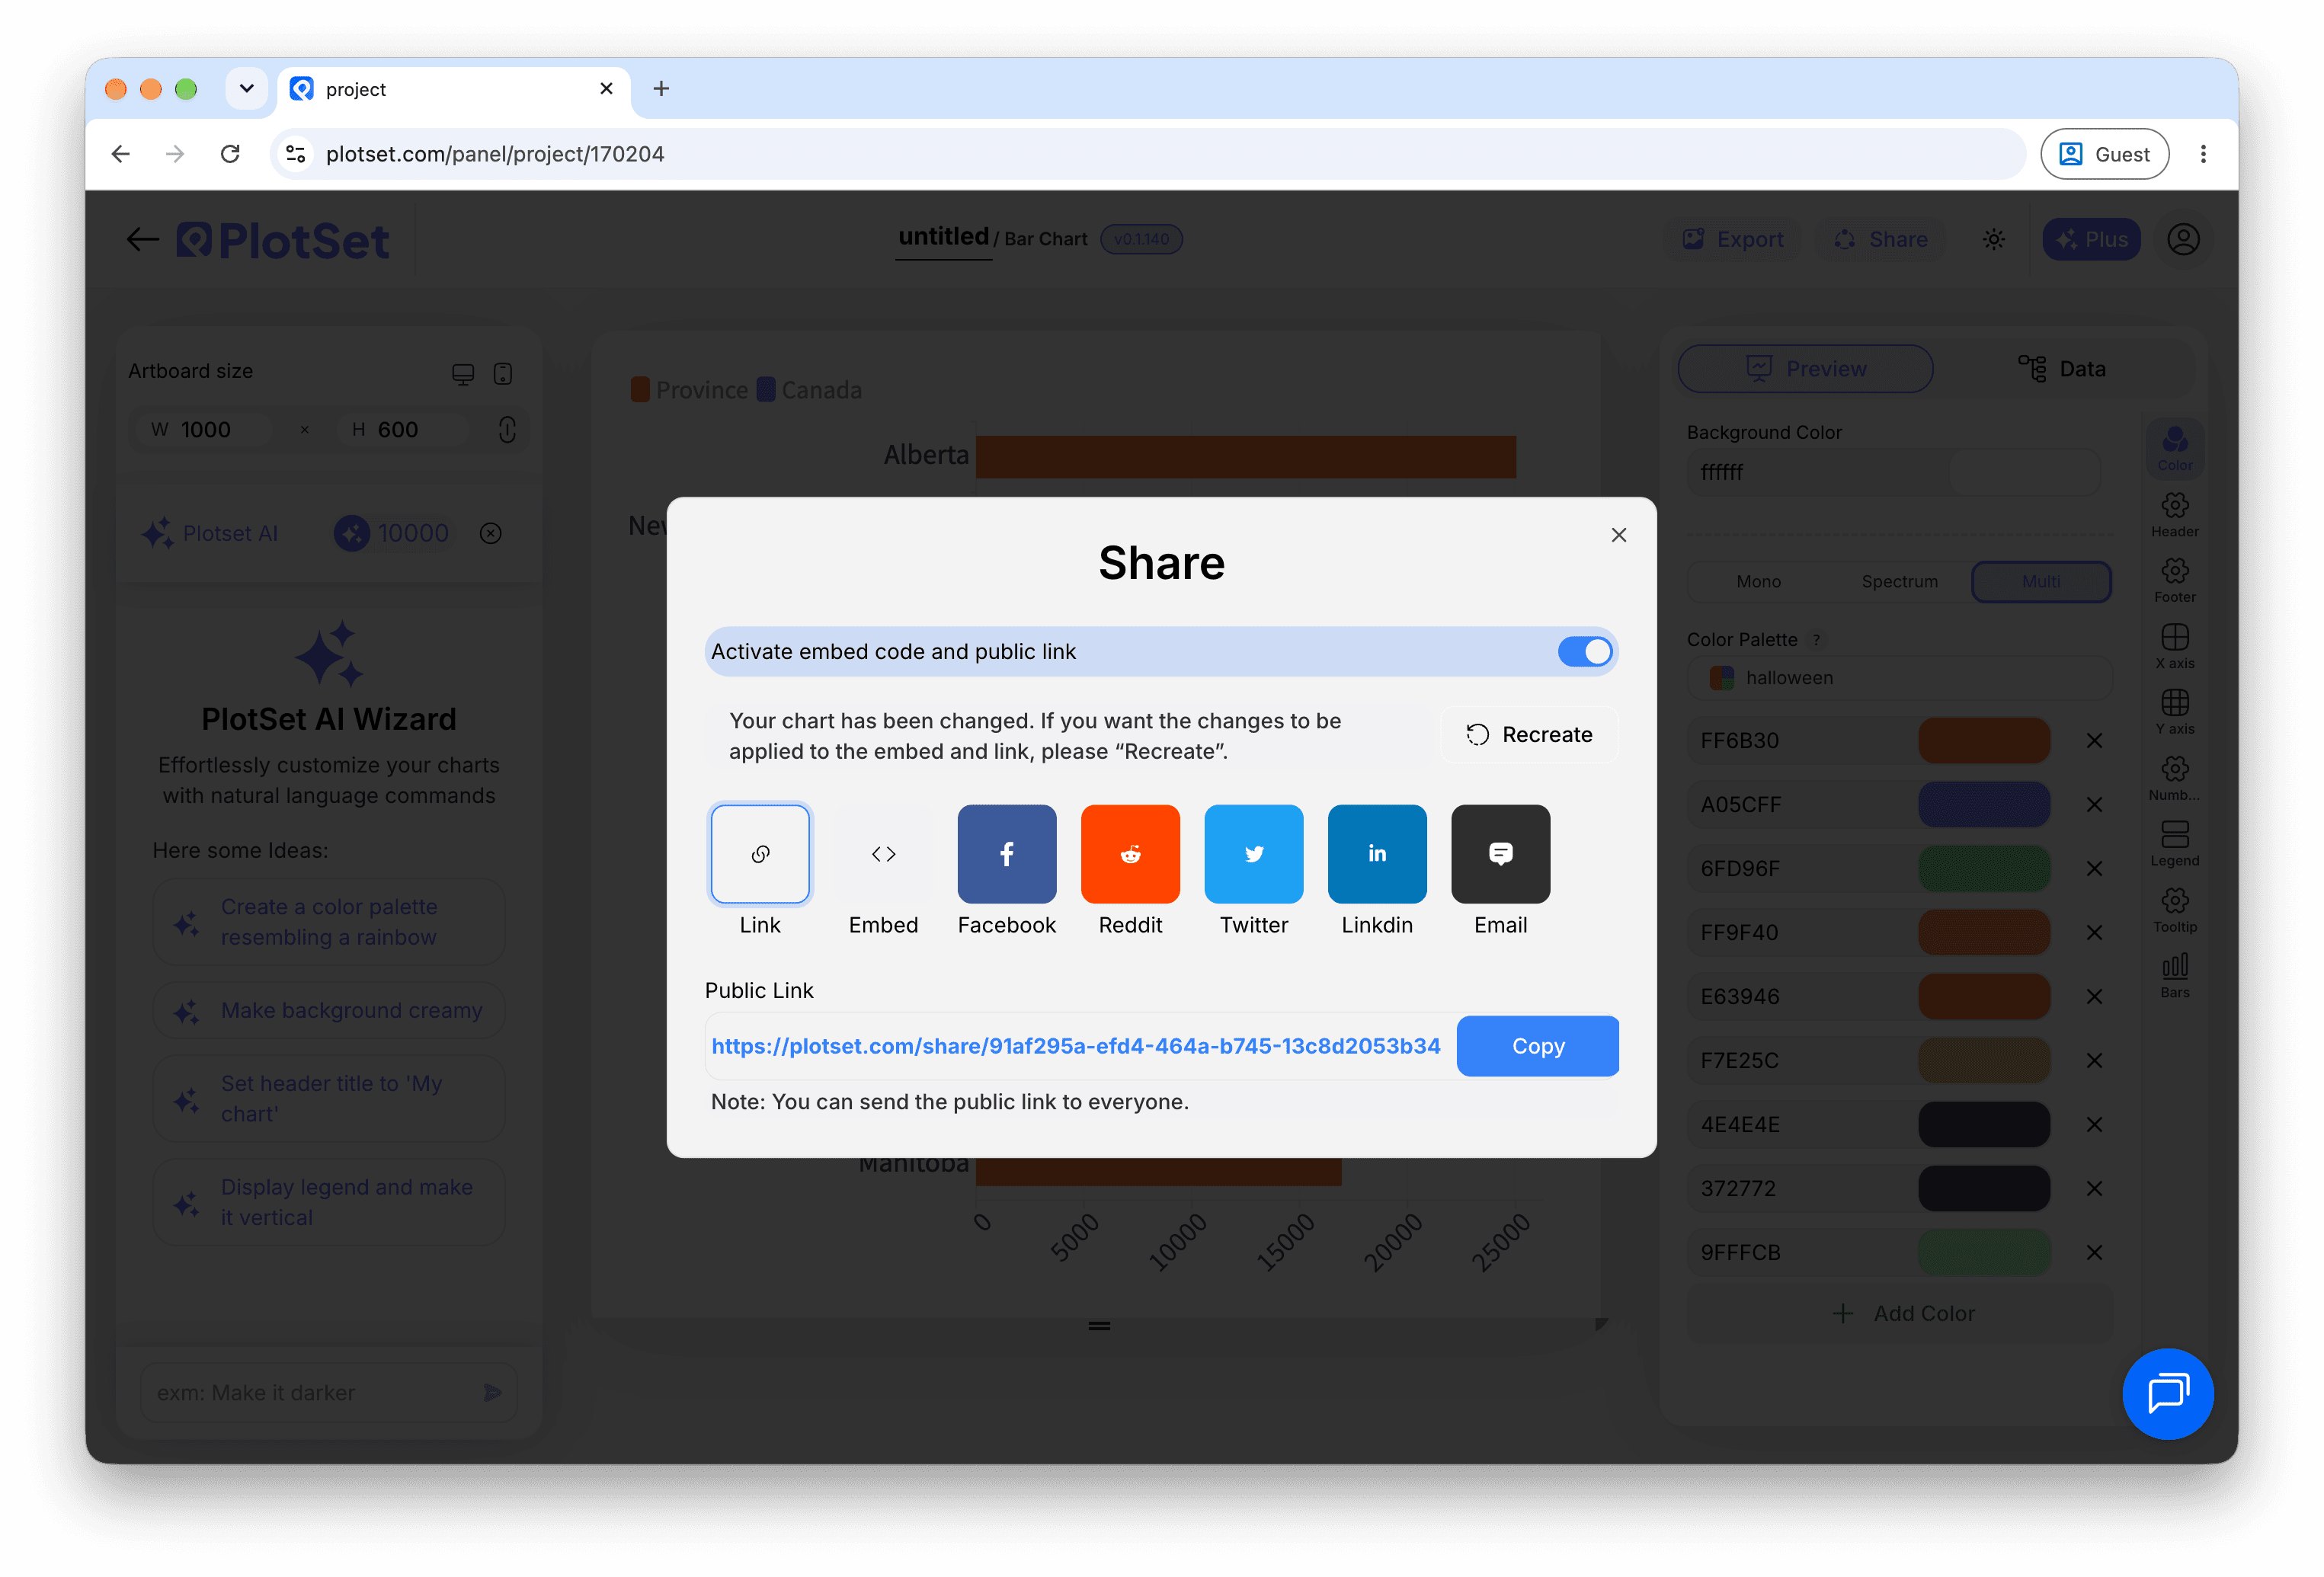
打开模板最后一段路对每种图表都一样:「Share」(分享)把图表变成一个在线的公开链接和一段嵌入代码,「Export」(导出)把它输出成静态文件。
打开嵌入代码和公开链接的开关,图表就发布出去了。链接可以放心发给任何人;嵌入代码以 iframe 的形式放进任意页面,悬停提示和交互效果都会保留。之后修改了图表,点「Recreate」就能把改动同步到链接和嵌入代码两边。
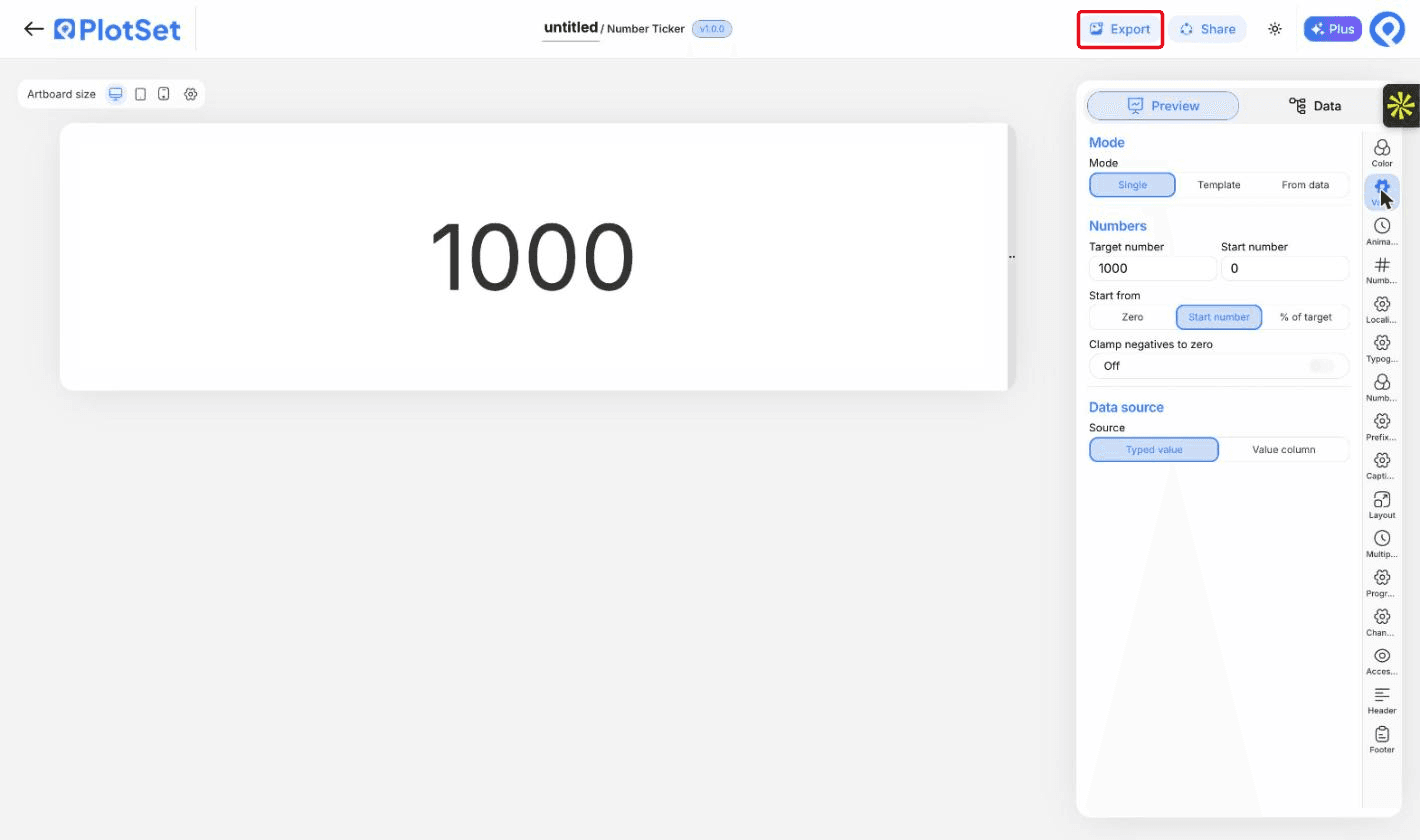
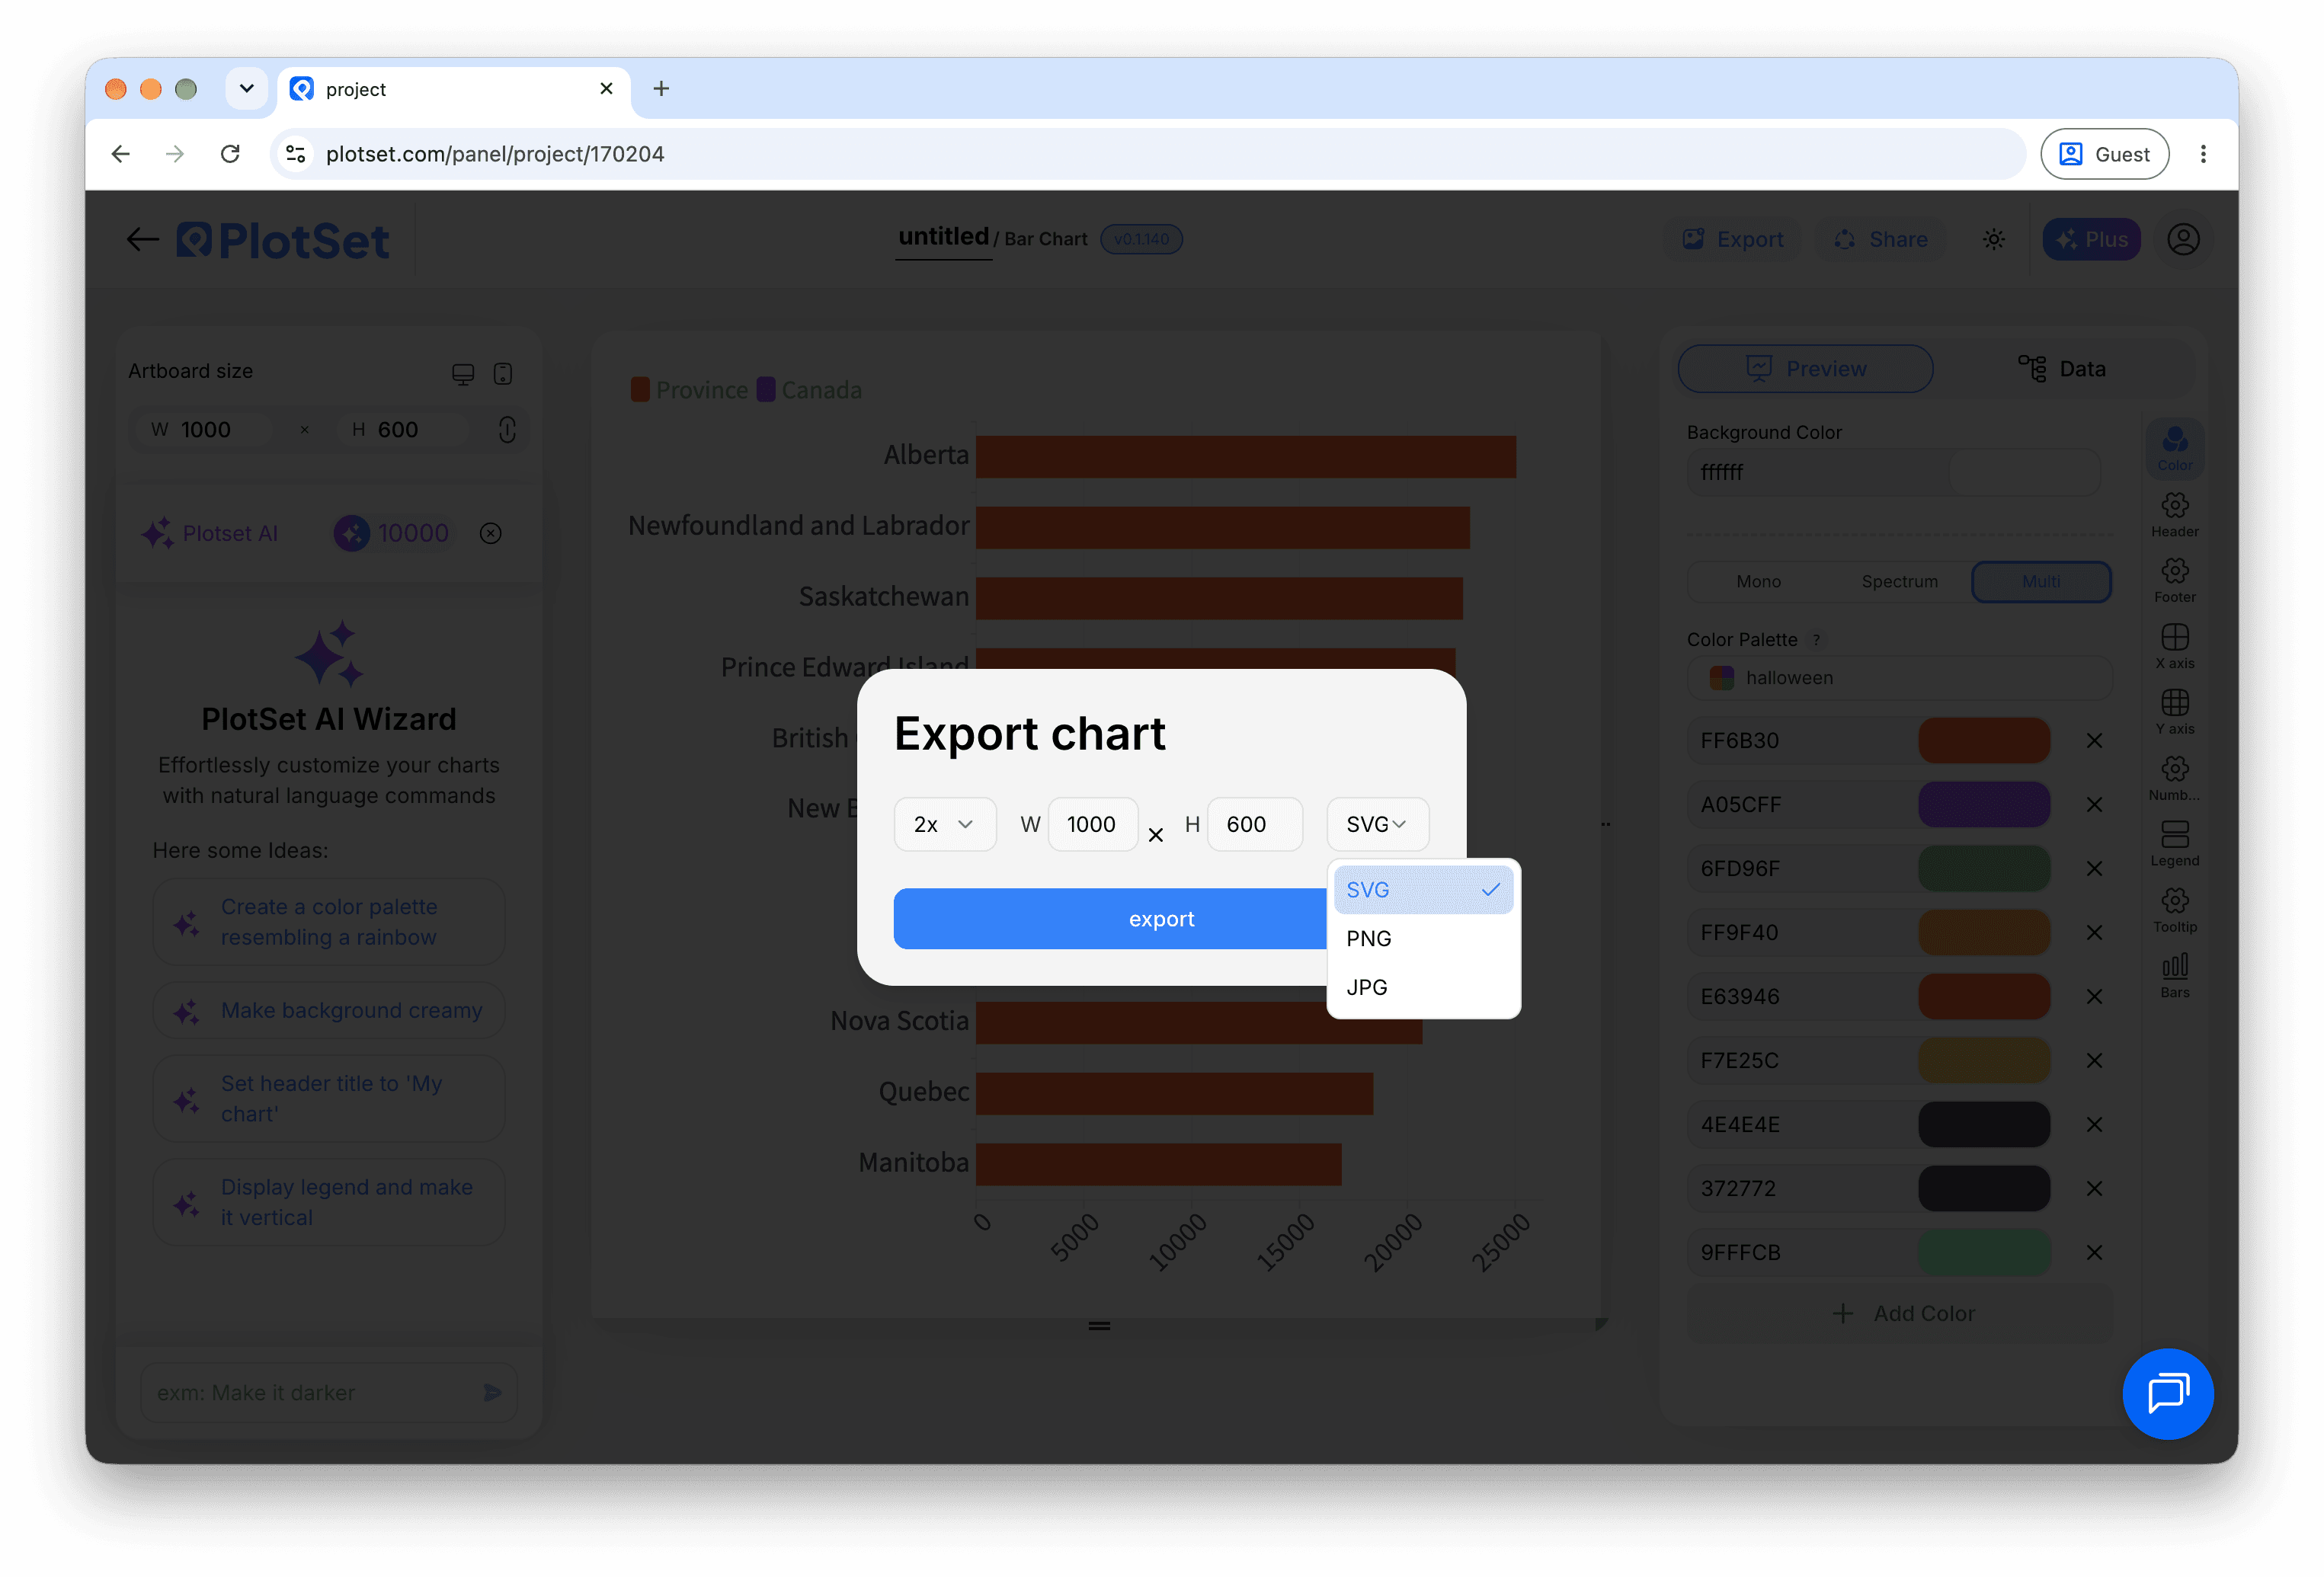
「Export」会按你需要的尺寸输出一份静态副本。SVG 放到多大都清晰,还能在设计工具里继续编辑;幻灯片和文档用 PNG 或 JPG 最稳妥。想让图片在高分屏上够锐利,关键就是那个倍数设置。
A start number close to the target shows growth honestly. Start at zero for a figure that is new.
Two to three seconds is enough for most pages.
A short line under the number says what it counts.
1.3M reads faster than 1,284,500 in a narrow embed.
Four digit numbers print without one. Figures of 10,000 and over get it.
From data mode needs a value column. Check that it is bound and holds numbers.
It runs when the chart loads. Reload the page to see it again.
Auto-fit shrinks the figures to the smallest cell. Reduce the columns or shorten the longest value.
不确定 Number Ticker 是否是正确选择?查看它是什么、何时使用以及何时不使用。
Yes. Set a start number higher than the target.
免费开始,600+ 模板任选。无需信用卡。