
这里的每张图表,最初都是一张表格。
地图、柱状图竞赛、矩形树图、象形图等。打开任意一张,换上你自己的数据。
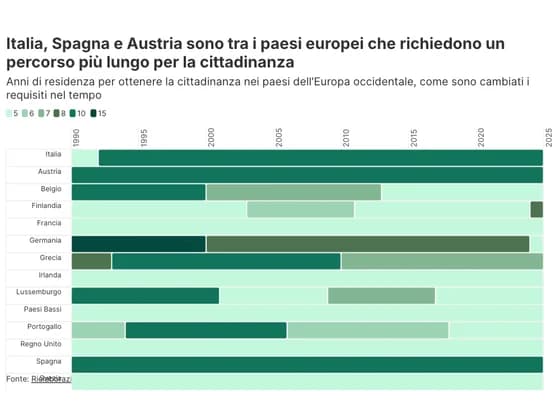 Gantt chartItalia, Spagna e Austria sono tra i paesi europei che richiedono un percorso più lungo per la…
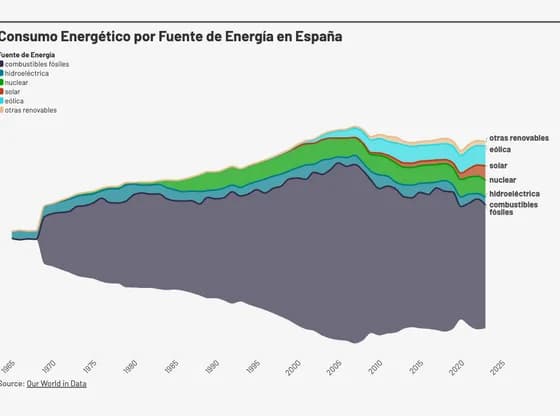 Line, bar and pie chartsConsumo Energético por Fuente de Energía en España
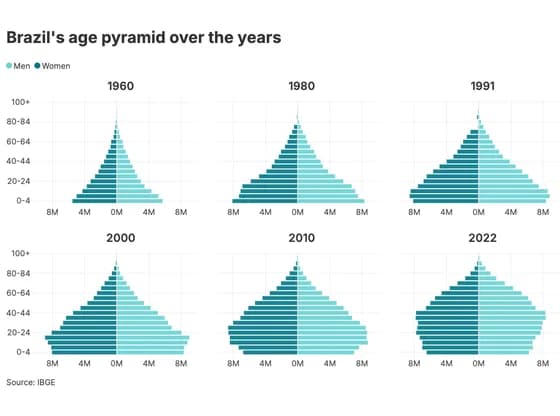 Line, bar and pie chartsBrazil's age pyramid over the years
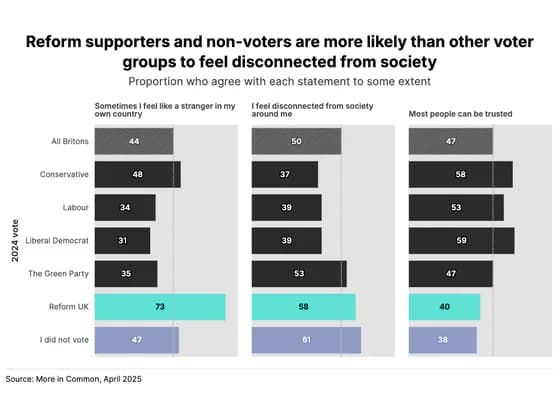 Line, bar and pie chartsReform supporters and non-voters are more likely than other voter groups to feel disconnected…
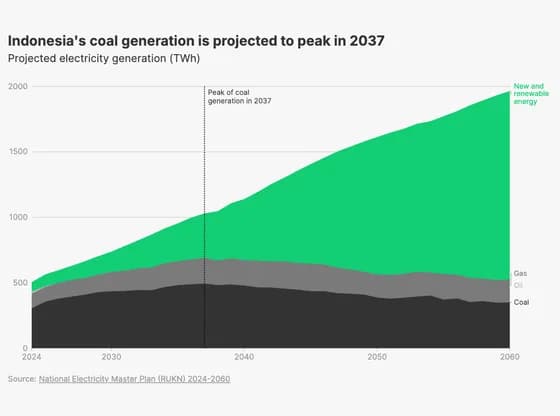 Line, bar and pie chartsIndonesia's coal generation is projected to peak in 2037
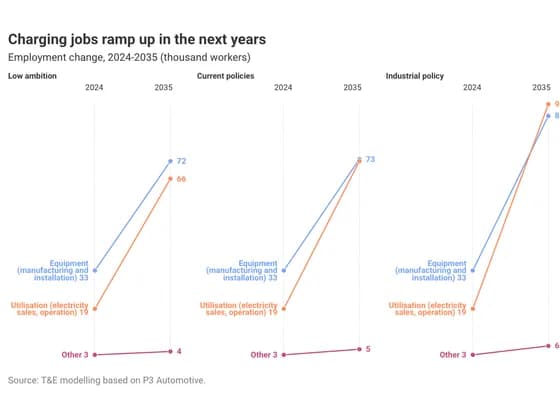 Slope chartCharging jobs ramp up in the next years
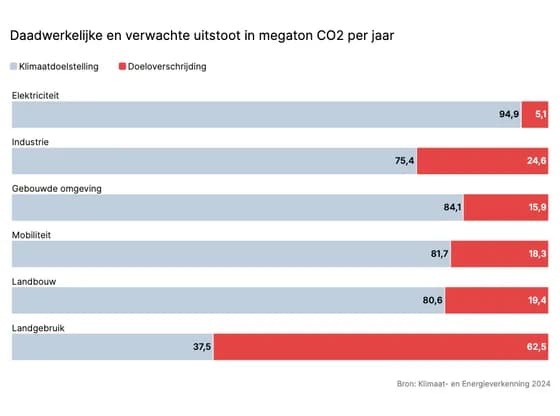 Line, bar and pie chartsDaadwerkelijke en verwachte uitstoot in megaton CO2 per jaar
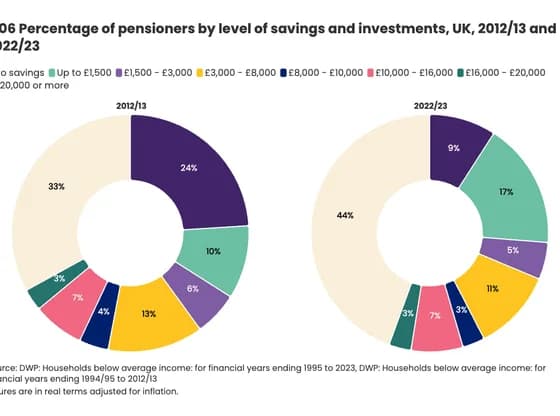 Line, bar and pie charts6.06 Percentage of pensioners by level of savings and investments, UK, 2012/13 and 2022/23
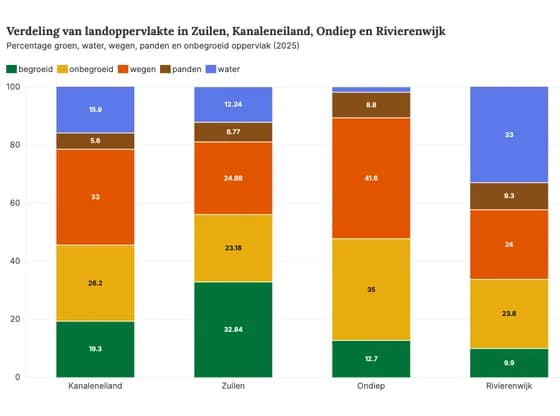 Line, bar and pie chartsVerdeling van landoppervlakte in Zuilen, Kanaleneiland, Ondiep en Rivierenwijk
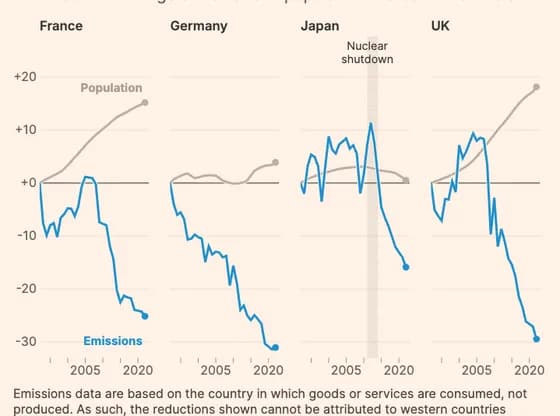 Line, bar and pie chartsCarbon emissions trajectories are shaped far more by innovation and policy than demographics
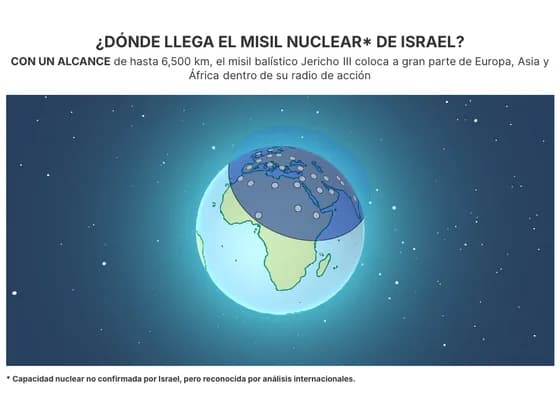 3D globe¿DÓNDE LLEGA EL MISIL NUCLEAR* DE ISRAEL?
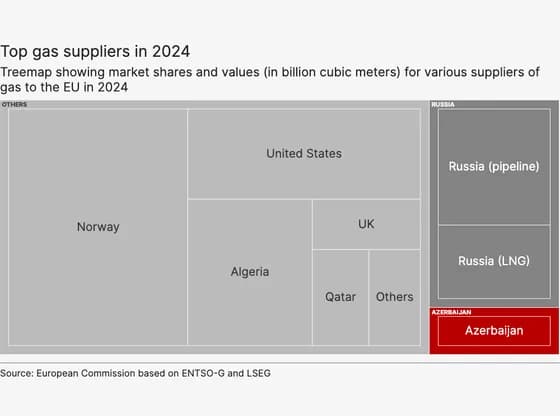 HierarchyTop gas suppliers in 2024
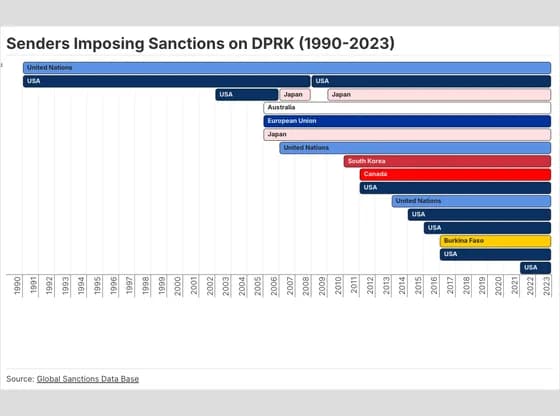 Gantt chartSenders Imposing Sanctions on DPRK (1990-2023)
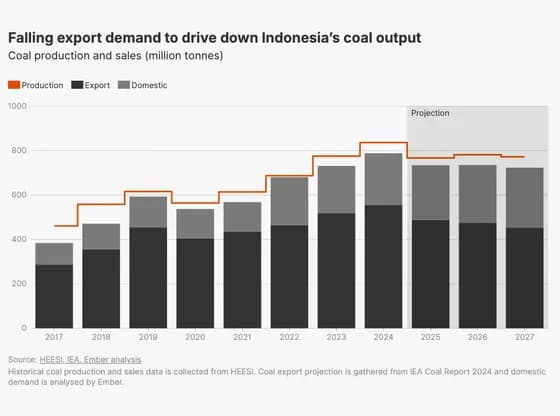 Line, bar and pie chartsFalling export demand to drive down Indonesia’s coal output
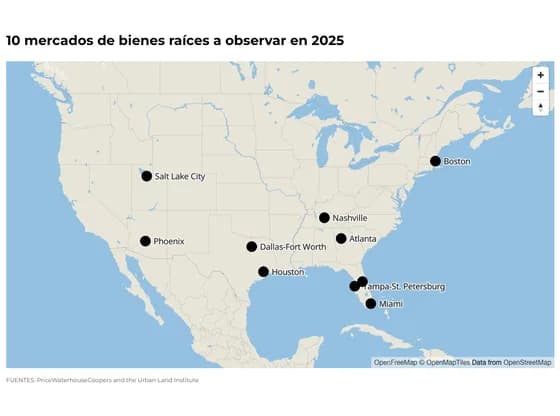 3D map10 mercados de bienes raíces a observar en 2025
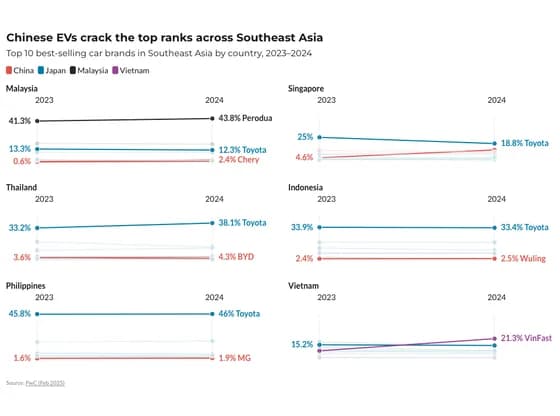 Slope chartChinese EVs crack the top ranks across Southeast Asia
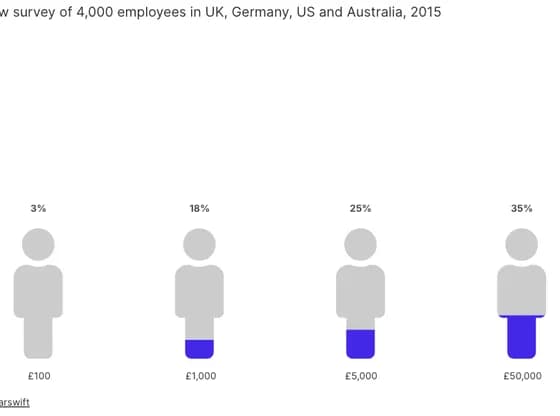 PictogramPercentage of employees willing to sell company data
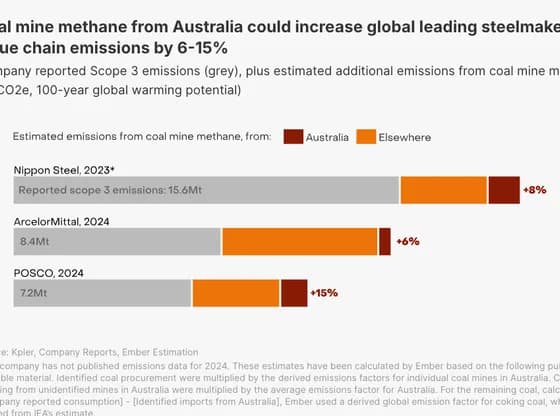 Interactive SVGCoal mine methane from Australia could increase global leading steelmakers' value chain…
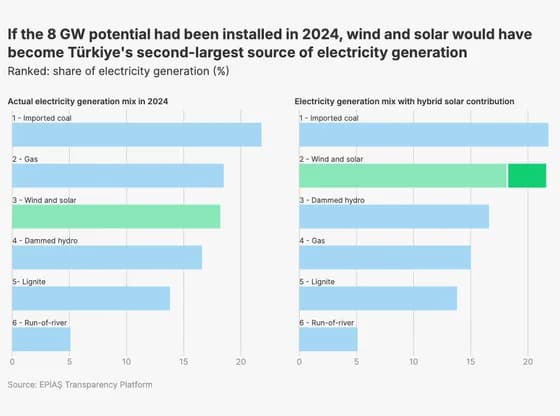 Line, bar and pie chartsIf the 8 GW potential had been installed in 2024, wind and solar would have become Türkiye's…
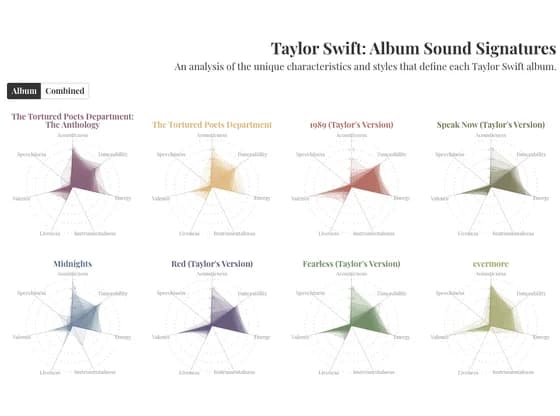 Radar chartTaylor Swift: Album Sound Signatures