
这里的每张图表,最初都是一张表格。
地图、柱状图竞赛、矩形树图、象形图等。打开任意一张,换上你自己的数据。
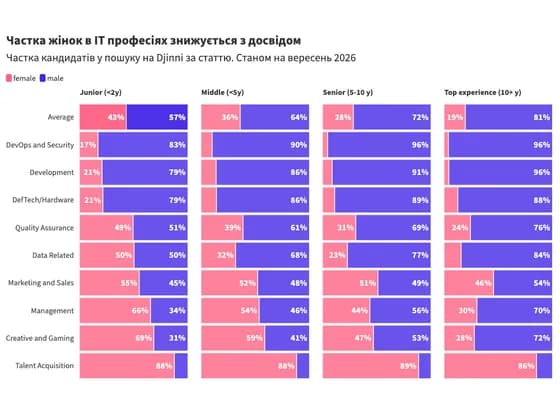 Line, bar and pie chartsЧастка жінок в IT професіях знижується з досвідом
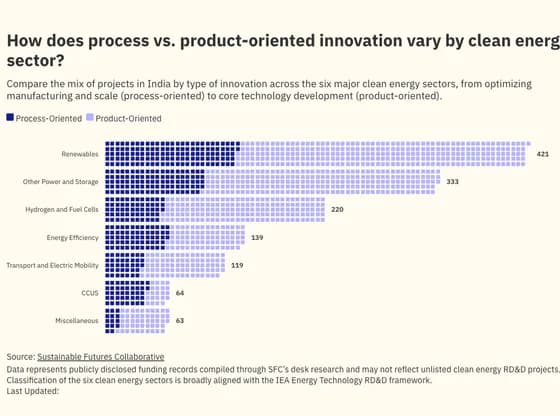 PictogramHow does process vs. product-oriented innovation vary by clean energy sector?
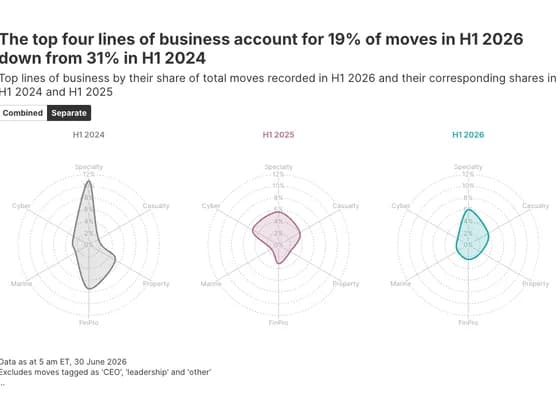 Radar chartThe top four lines of business account for 19% of moves in H1 2026 down from 31% in H1 2024
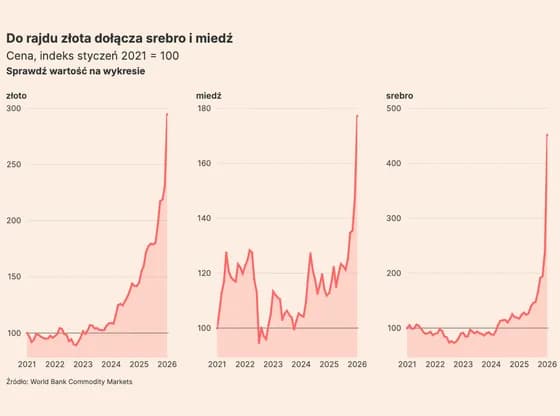 Line, bar and pie chartsDo rajdu złota dołącza srebro i miedź
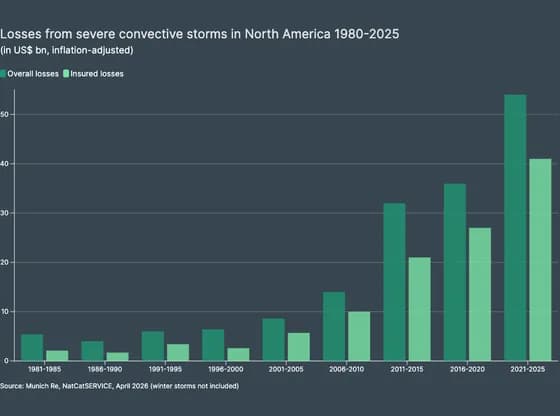 Line, bar and pie chartsLosses from severe convective storms in North America 1980-2025
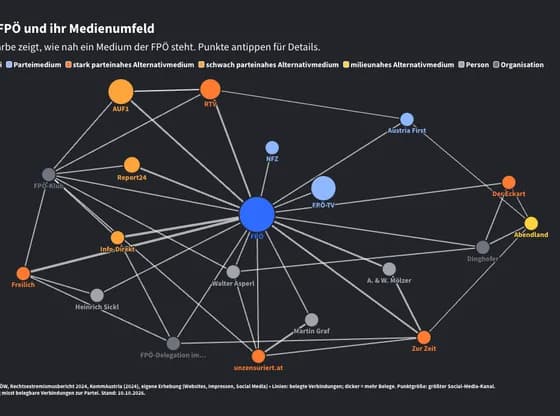 Network graphDie FPÖ und ihr Medienumfeld
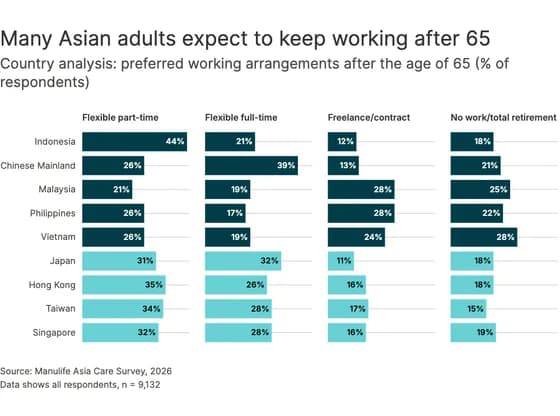 Line, bar and pie chartsMany Asian adults expect to keep working after 65
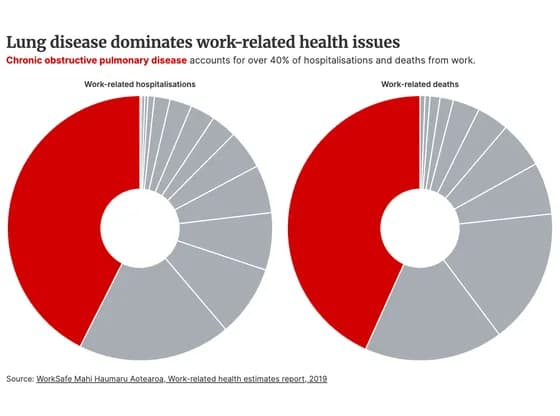 Line, bar and pie chartsLung disease dominates work-related health issues
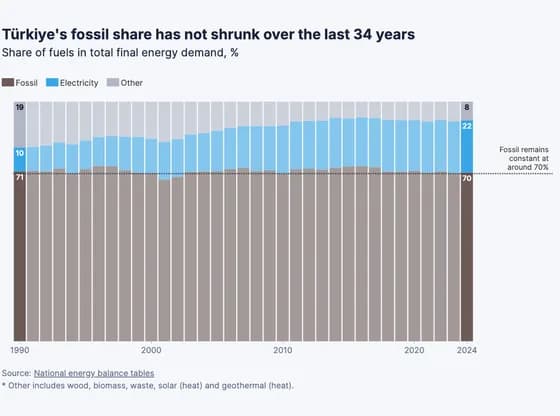 Line, bar and pie chartsTürkiye's fossil share has not shrunk over the last 34 years
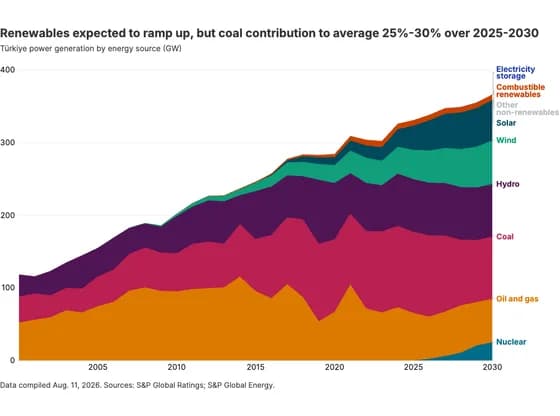 Line, bar and pie chartsRenewables expected to ramp up, but coal contribution to average 25%-30% over 2025-2030
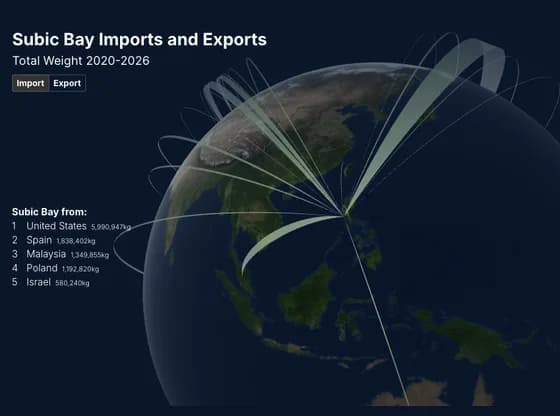 Connections and flow mapsSubic Bay Imports and Exports
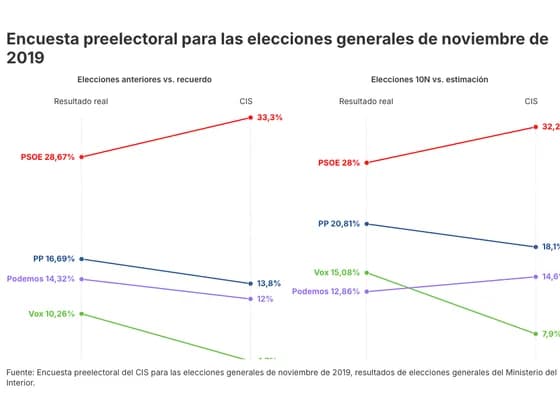 Slope chartEncuesta preelectoral para las elecciones generales de noviembre de 2019
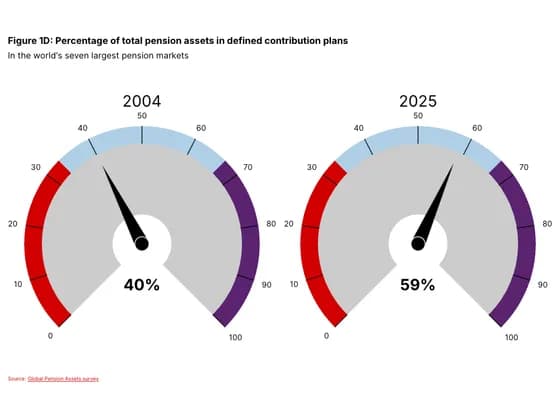 Counters and gaugesFigure 1D: Percentage of total pension assets in defined contribution plans
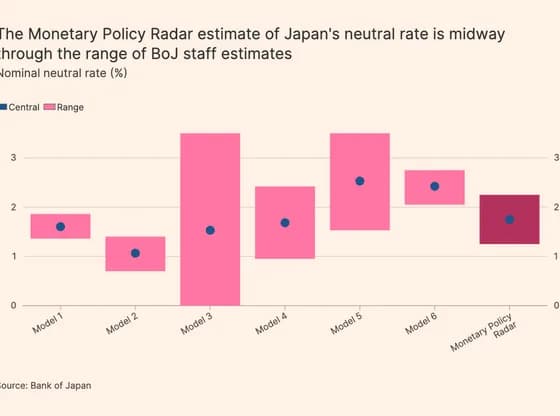 Line, bar and pie chartsThe Monetary Policy Radar estimate of Japan's neutral rate is midway through the range of BoJ…
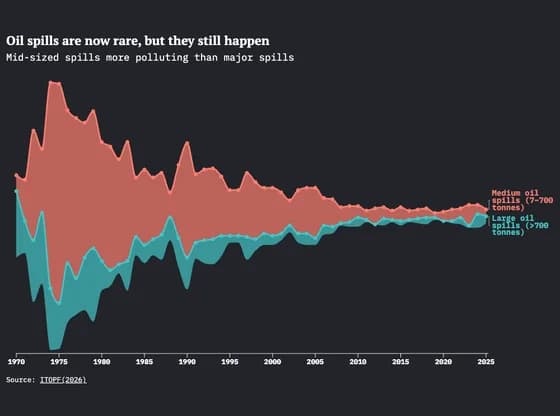 Line, bar and pie chartsOil spills are now rare, but they still happen
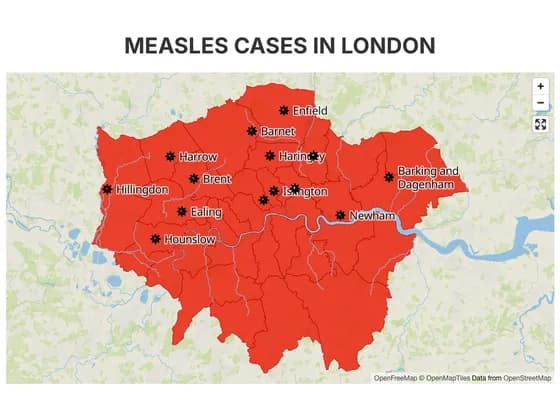 3D mapMEASLES CASES IN LONDON
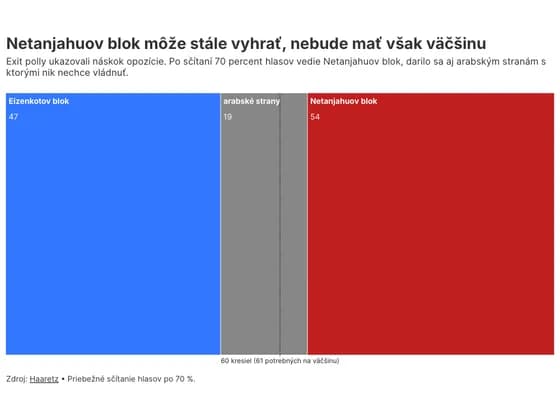 Elections and parliamentsNetanjahuov blok môže stále vyhrať, nebude mať však väčšinu
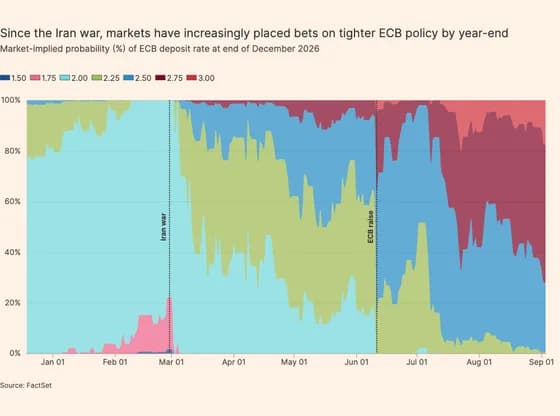 Line, bar and pie chartsSince the Iran war, markets have increasingly placed bets on tighter ECB policy by year-end
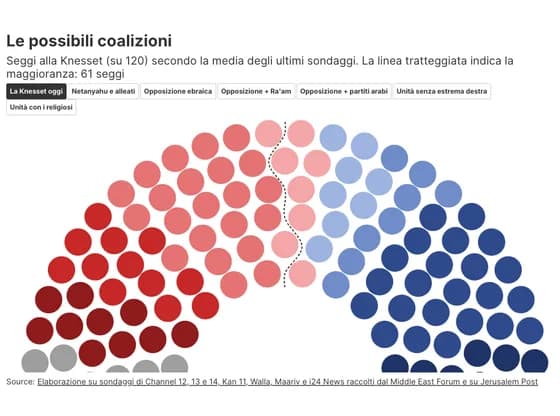 Elections and parliamentsLe possibili coalizioni
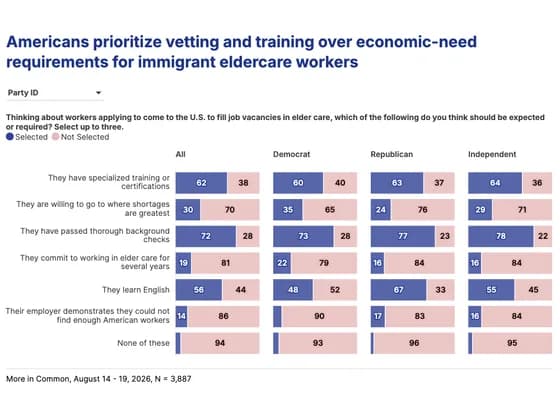 Line, bar and pie chartsAmericans prioritize vetting and training over economic-need requirements for immigrant…