
这里的每张图表,最初都是一张表格。
地图、柱状图竞赛、矩形树图、象形图等。打开任意一张,换上你自己的数据。
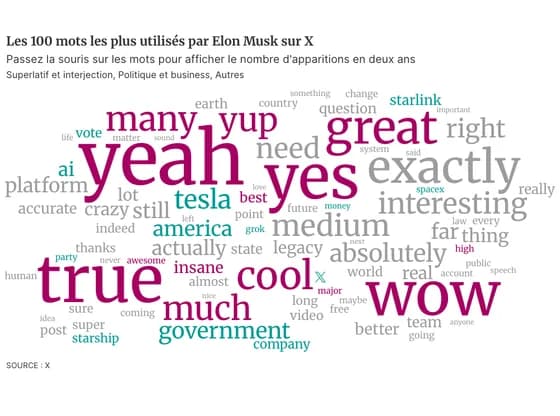 OtherLes 100 mots les plus utilisés par Elon Musk sur X
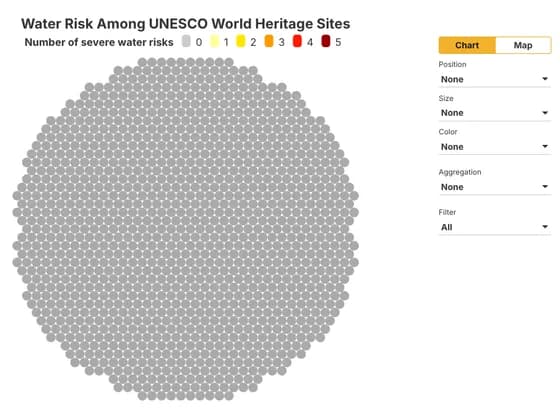 Interactive toolsWater Risk Among UNESCO World Heritage Sites
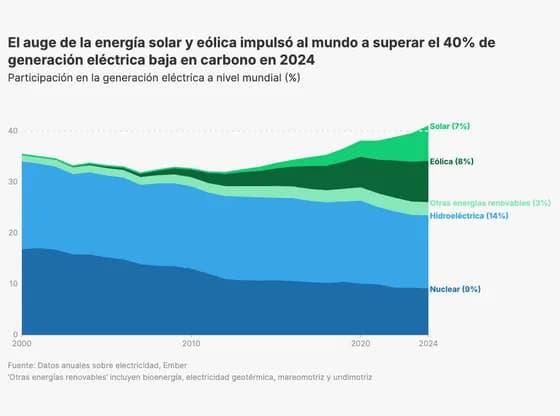 Line, bar and pie chartsEl auge de la energía solar y eólica impulsó al mundo a superar el 40% de generación eléctrica…
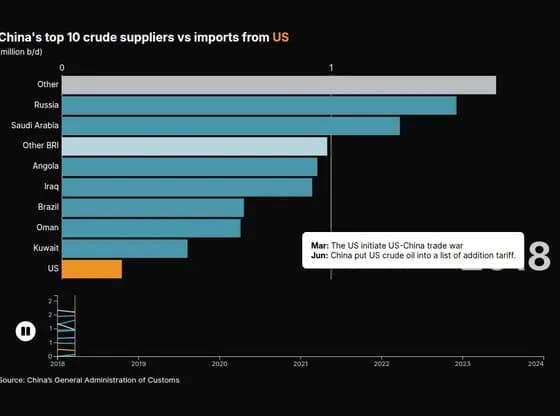 Animated chartsChina's top 10 crude suppliers vs imports from US
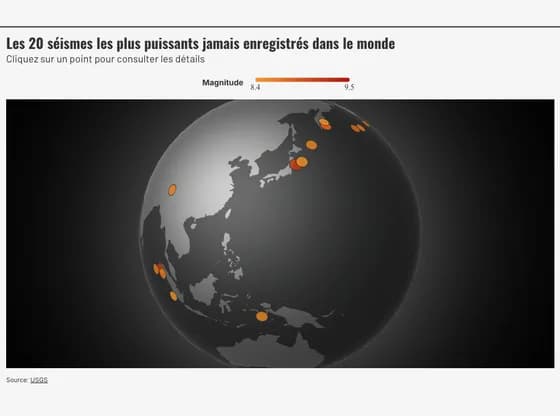 3D globeLes 20 séismes les plus puissants jamais enregistrés dans le monde
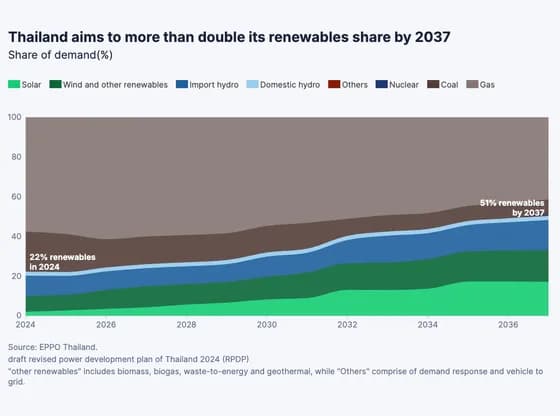 Line, bar and pie chartsThailand aims to more than double its renewables share by 2037
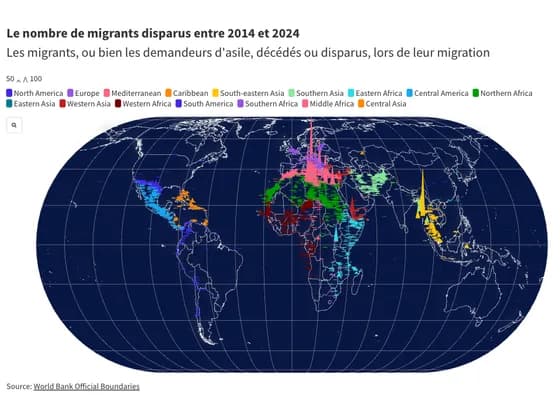 MapsLe nombre de migrants disparus entre 2014 et 2024
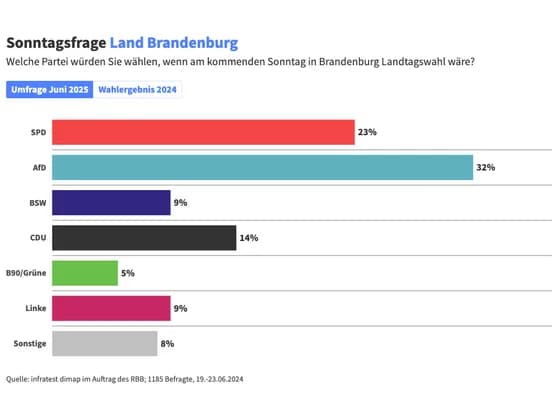 Line, bar and pie chartsSonntagsfrage Land Brandenburg
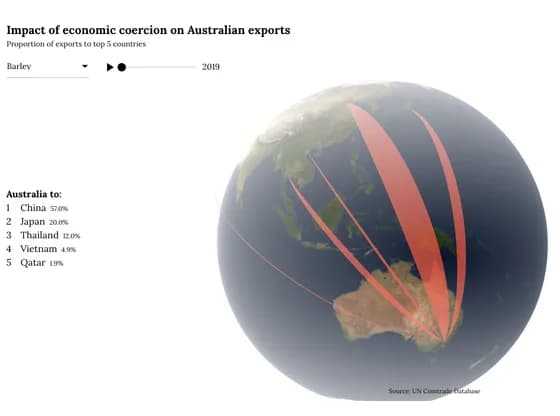 Connections and flow mapsImpact of economic coercion on Australian exports
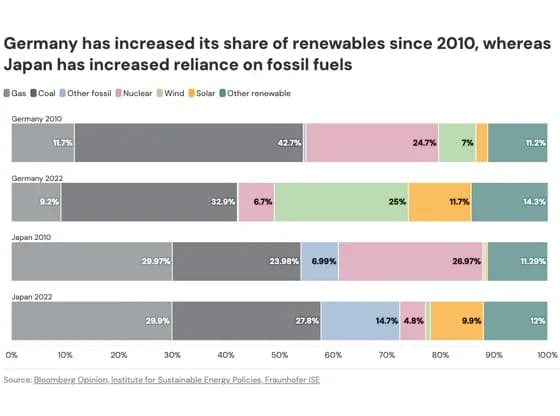 Line, bar and pie chartsGermany has increased its share of renewables since 2010, whereas Japan has increased reliance…
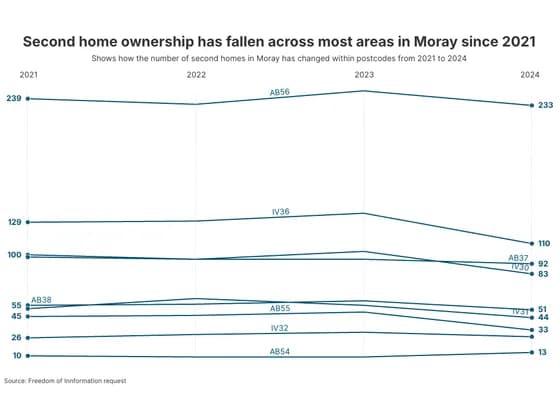 Slope chartSecond home ownership has fallen across most areas in Moray since 2021
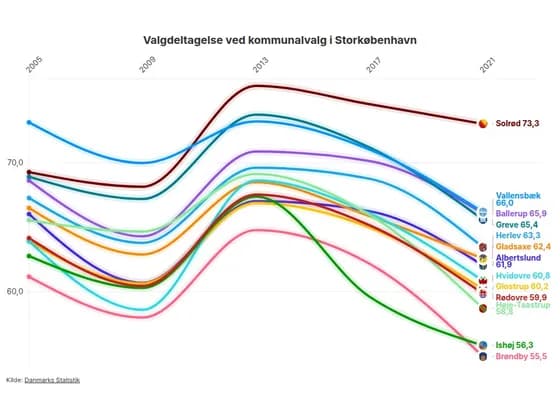 Animated chartsValgdeltagelse ved kommunalvalg i Storkøbenhavn
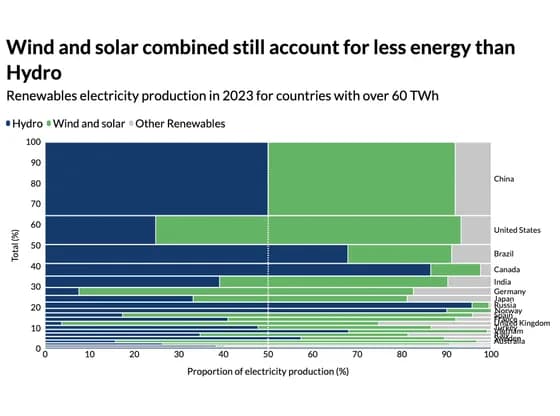 MarimekkoWind and solar combined still account for less energy than Hydro
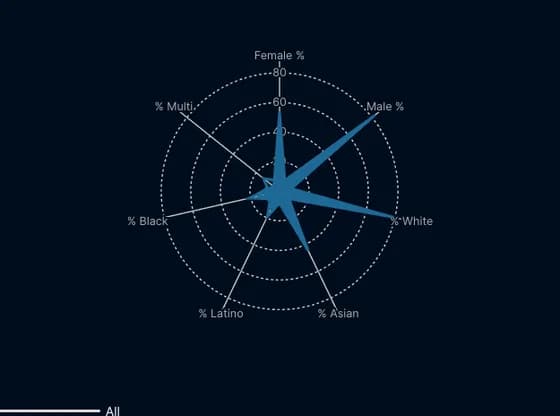 Radar chartDiversity in Tech: Who’s Really at the Table?
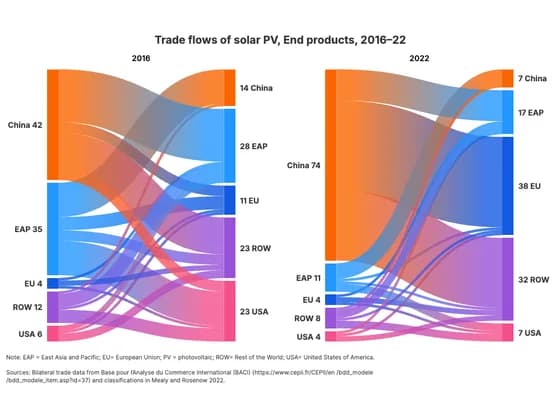 Sankey diagramTrade flows of solar PV, End products, 2016–22
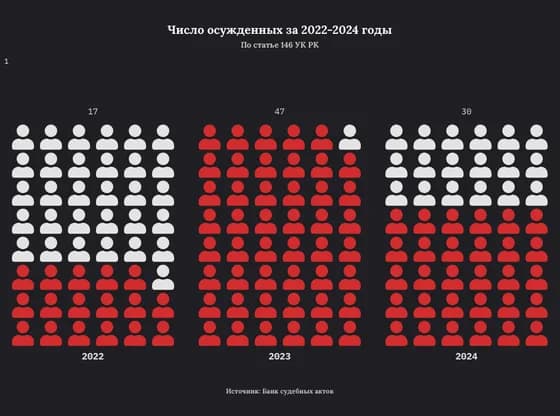 PictogramЧисло осужденных за 2022-2024 годы
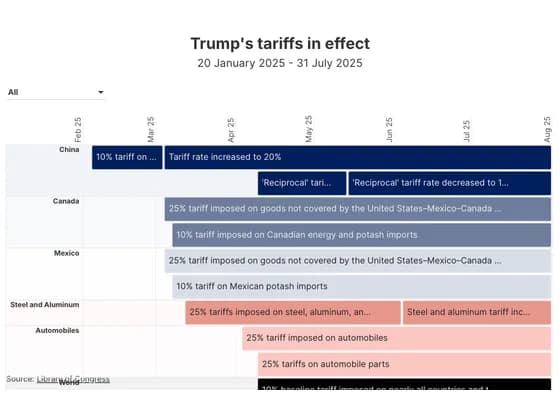 Gantt chartTrump's tariffs in effect
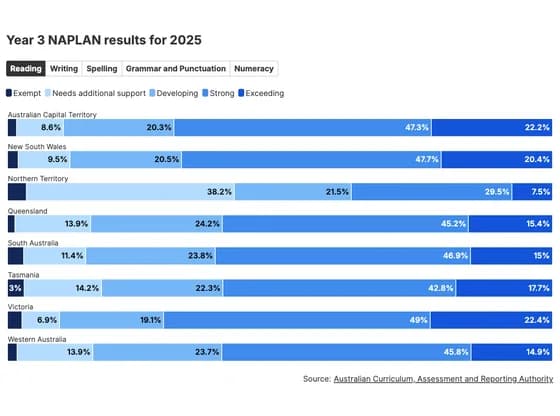 Line, bar and pie chartsYear 3 NAPLAN results for 2025
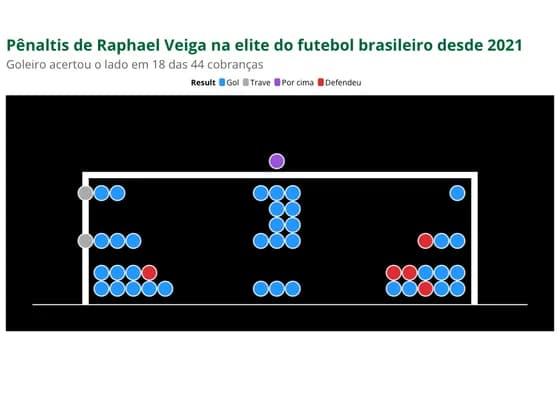 SportsPênaltis de Raphael Veiga na elite do futebol brasileiro desde 2021
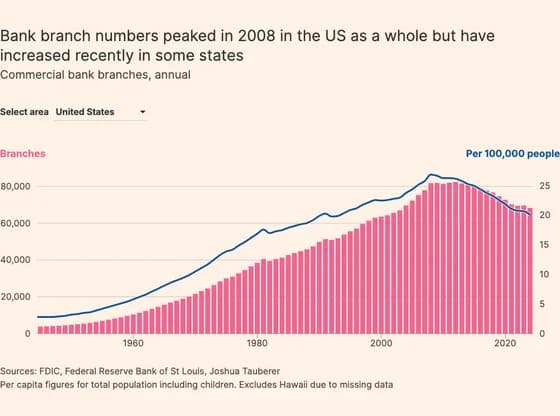 Line, bar and pie chartsBank branch numbers peaked in 2008 in the US as a whole but have increased recently in some states