
这里的每张图表,最初都是一张表格。
地图、柱状图竞赛、矩形树图、象形图等。打开任意一张,换上你自己的数据。
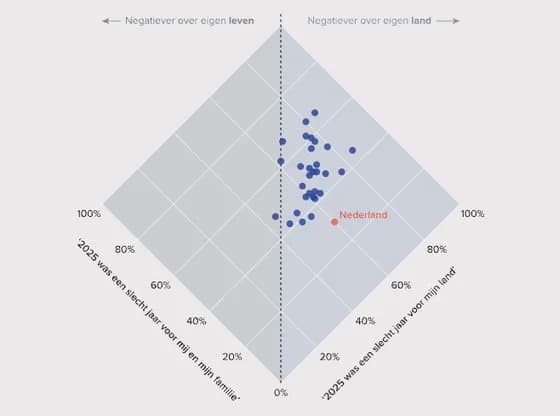 Interactive SVG20260407 - SvT - Het gaat slecht 01 SVG
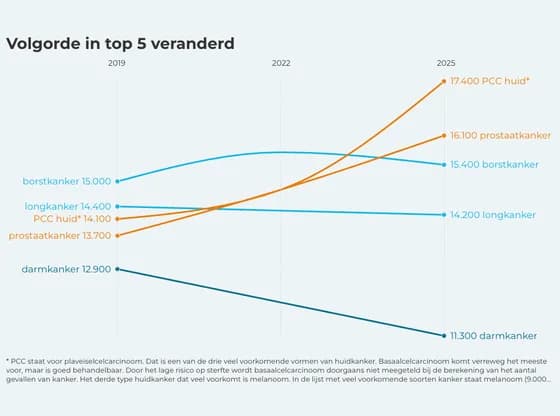 Slope chartVolgorde in top 5 veranderd
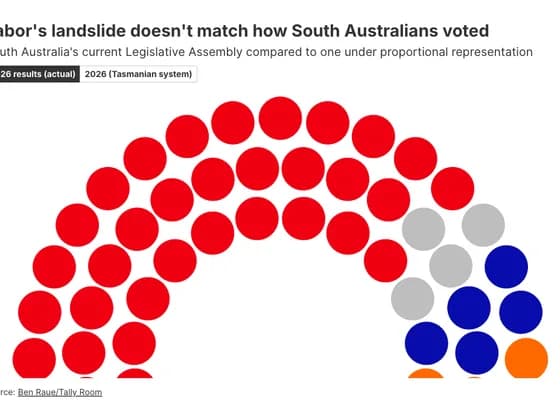 Elections and parliamentsLabor's landslide doesn't match how South Australians voted
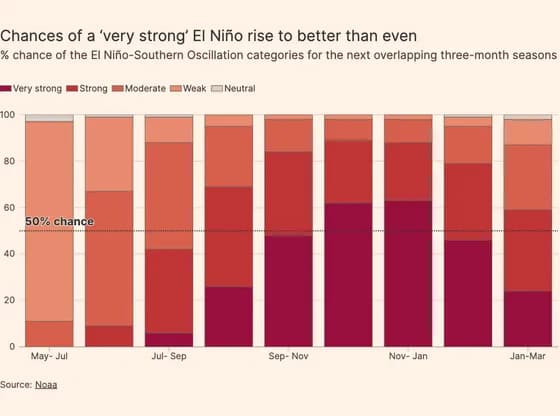 Line, bar and pie chartsChances of a ‘very strong’ El Niño rise to better than even
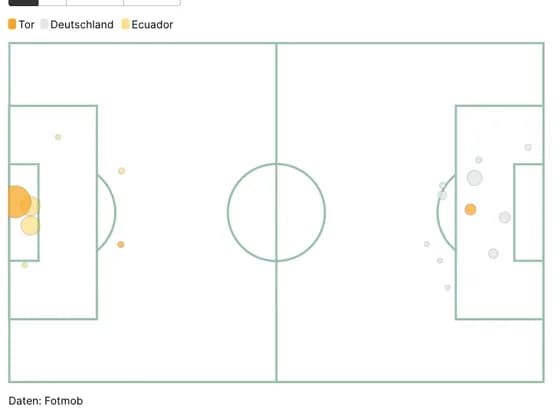 SportsDFB-Teamr Chancen vs Ecuado
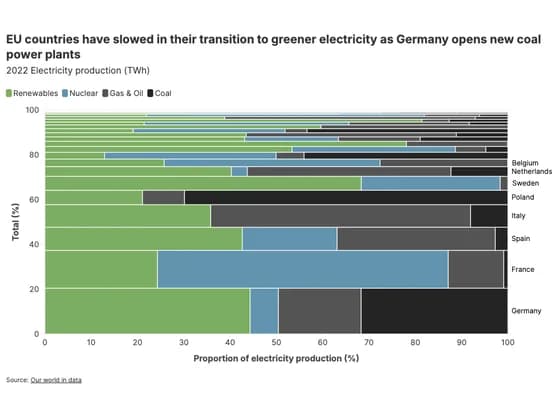 MarimekkoEU countries have slowed in their transition to greener electricity as Germany opens new coal…
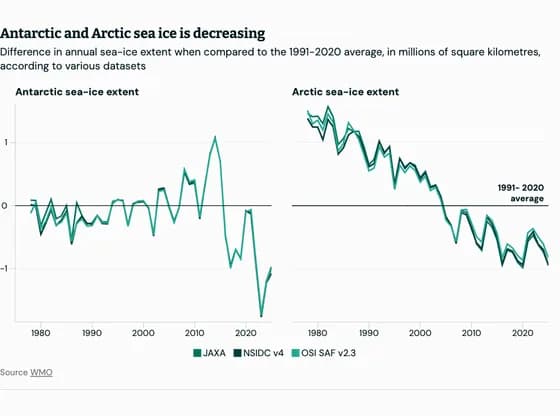 Line, bar and pie chartsAntarctic and Arctic sea ice is decreasing
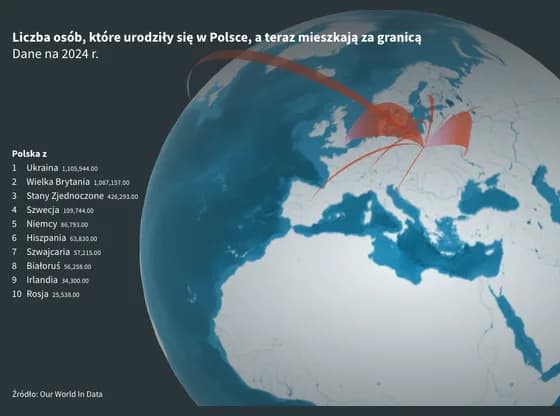 Connections and flow mapsLiczba osób, które urodziły się w Polsce, a teraz mieszkają za granicą
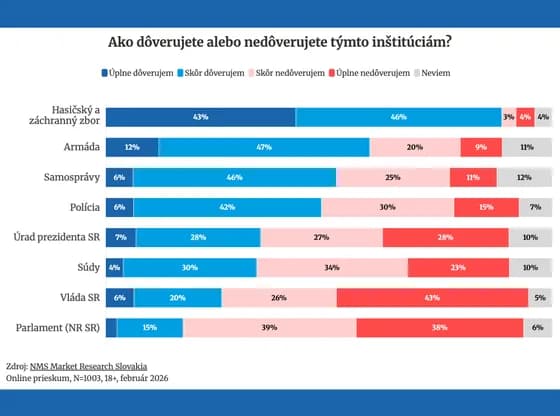 Line, bar and pie chartsAko dôverujete alebo nedôverujete týmto inštitúciám?
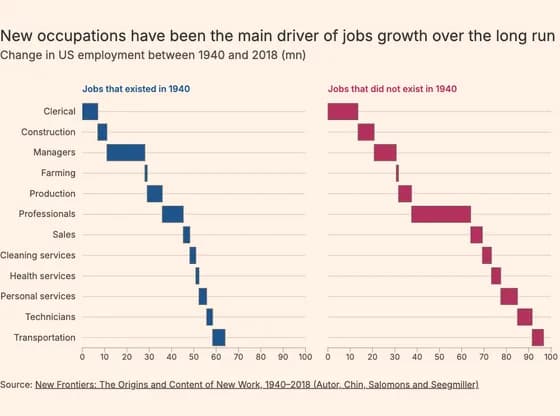 Line, bar and pie chartsNew occupations have been the main driver of jobs growth over the long run
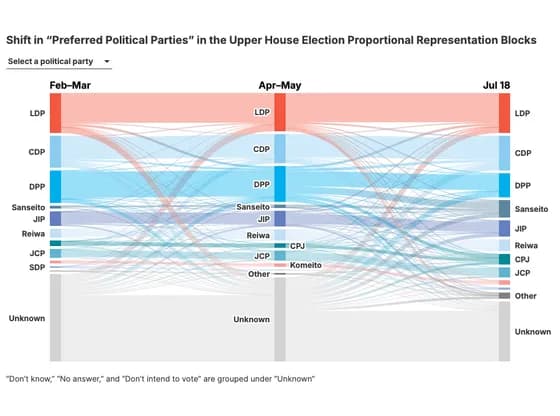 Sankey diagramShift in “Preferred Political Parties” in the Upper House Election Proportional Representation…
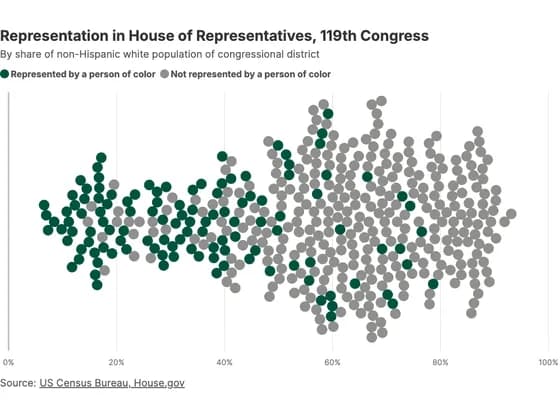 ScatterRepresentation in House of Representatives, 119th Congress
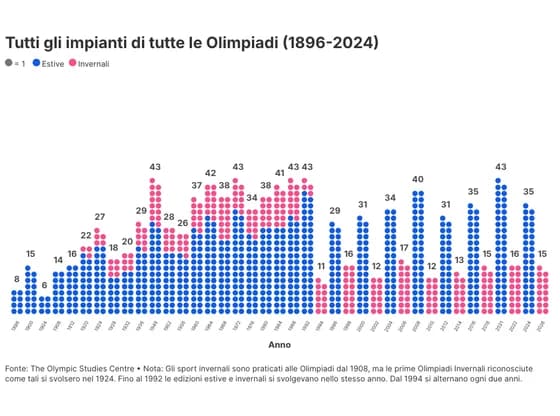 PictogramTutti gli impianti di tutte le Olimpiadi (1896-2024)
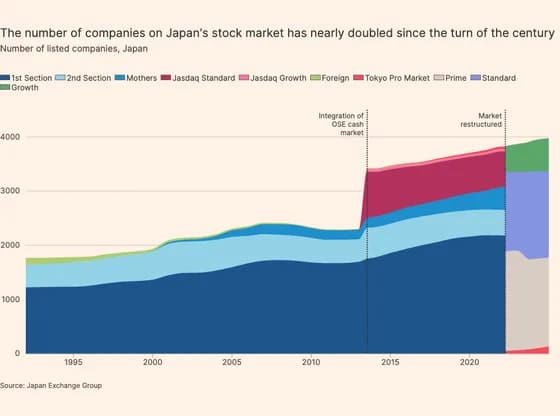 Line, bar and pie chartsThe number of companies on Japan's stock market has nearly doubled since the turn of the century
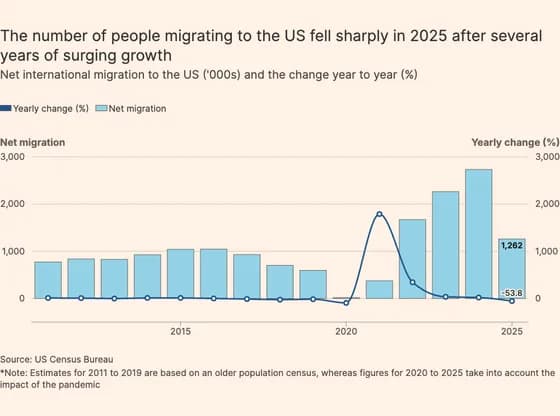 Line, bar and pie chartsThe number of people migrating to the US fell sharply in 2025 after several years of surging growth
 Line, bar and pie chartsThe most common impact of experiencing these administrative issues is making people think that…
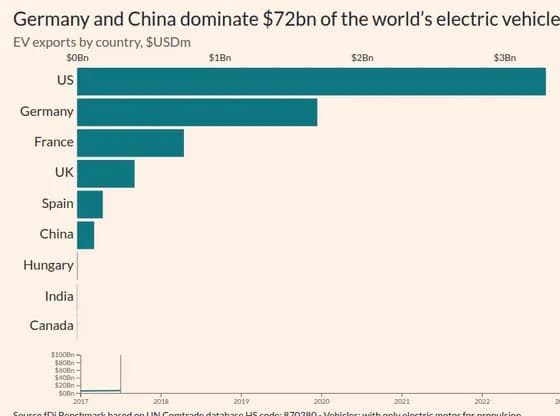 Animated chartsGermany and China dominate $72bn of the world’s electric vehicle exports
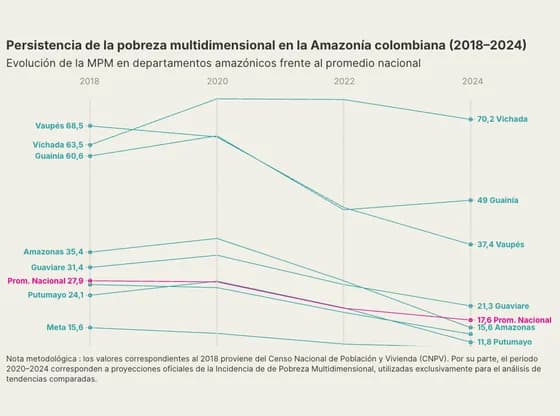 Slope chartPersistencia de la pobreza multidimensional en la Amazonía colombiana (2018–2024)
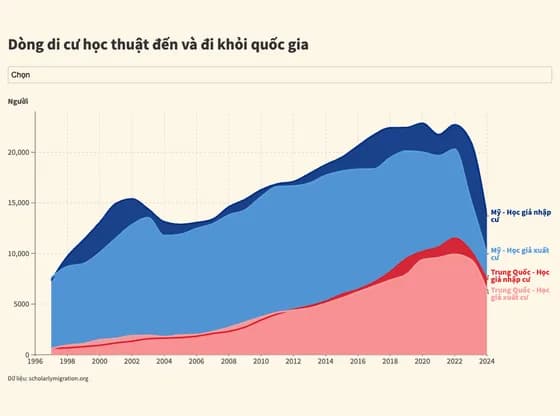 Line, bar and pie chartsDòng di cư học thuật đến và đi khỏi quốc gia
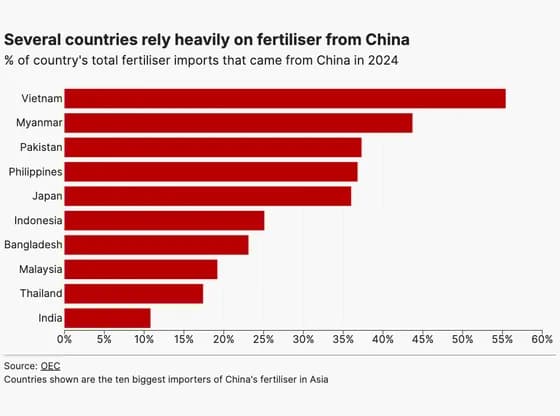 Line, bar and pie chartsSeveral countries rely heavily on fertiliser from China