
这里的每张图表,最初都是一张表格。
地图、柱状图竞赛、矩形树图、象形图等。打开任意一张,换上你自己的数据。
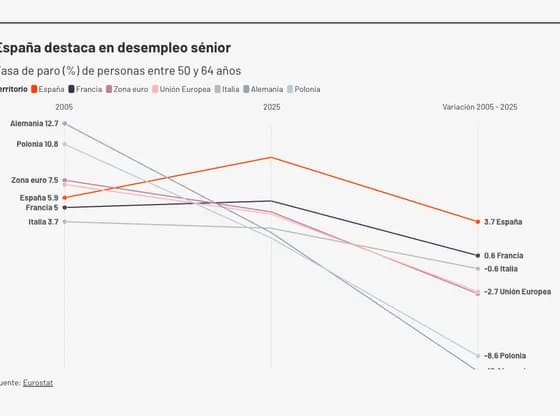 Slope chartEspaña destaca en desempleo sénior
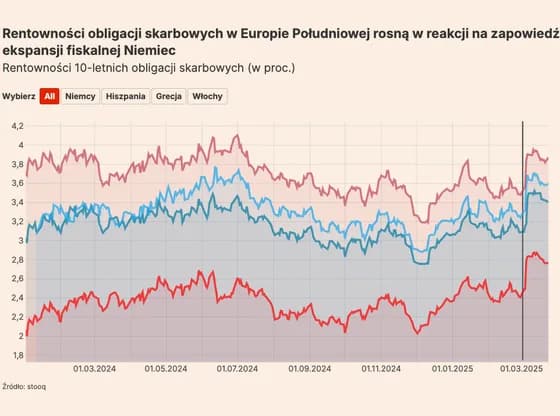 Line, bar and pie chartsRentowności obligacji skarbowych w Europie Południowej rosną w reakcji na zapowiedź ekspansji…
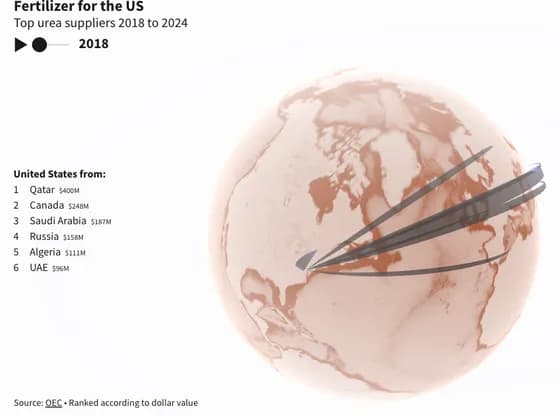 Connections and flow mapsFertilizer for the US
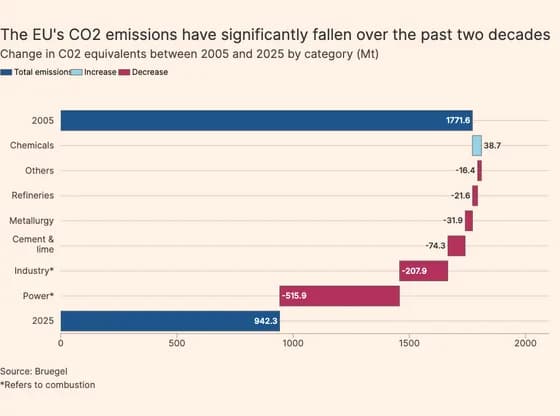 Line, bar and pie chartsThe EU's CO2 emissions have significantly fallen over the past two decades
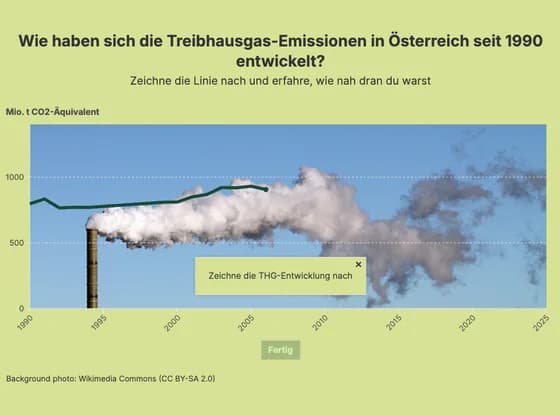 Interactive toolsWie haben sich die Treibhausgas-Emissionen in Österreich seit 1990 entwickelt?
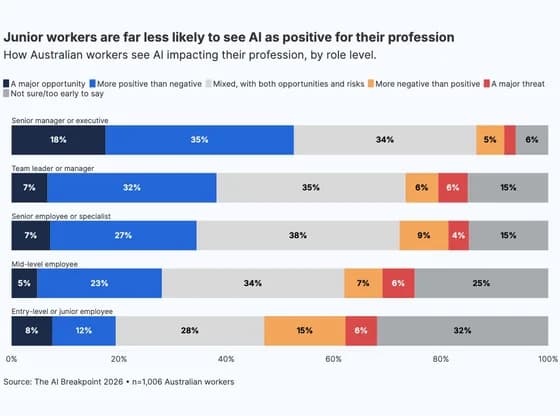 Line, bar and pie chartsJunior workers are far less likely to see AI as positive for their profession
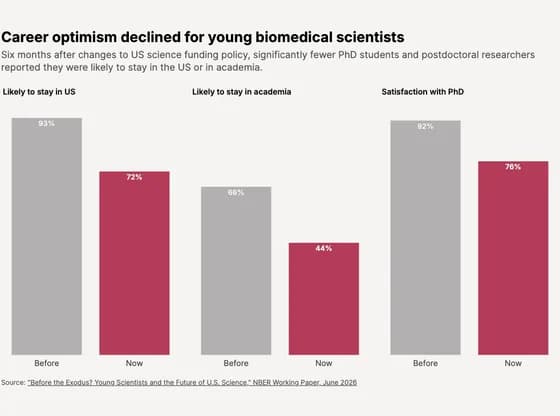 Line, bar and pie chartsCareer optimism declined for young biomedical scientists
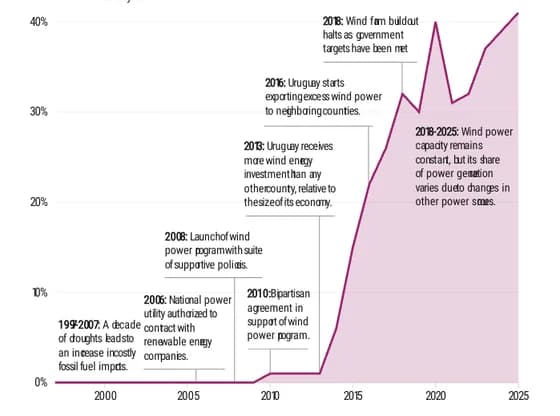 Interactive SVGIn Uruguay, bipartisan agreement spurs leap in wind power
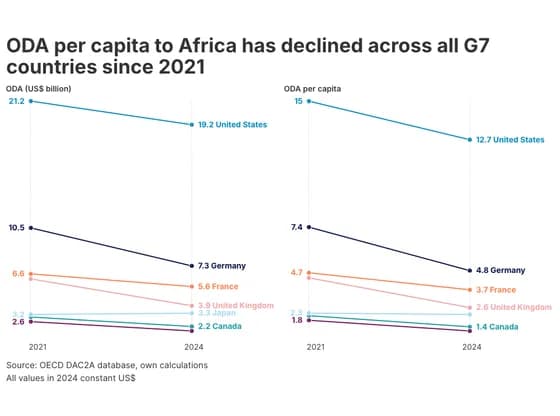 Slope chartODA per capita to Africa has declined across all G7 countries since 2021
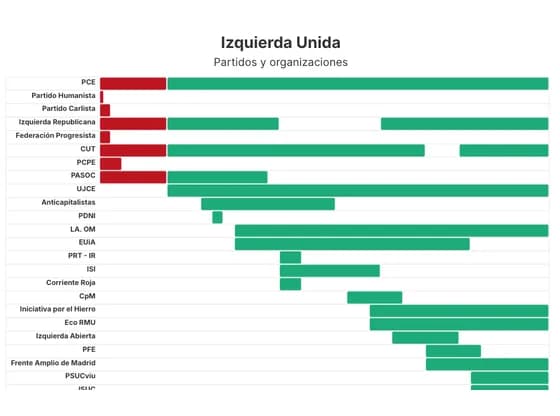 Gantt chartIzquierda Unida
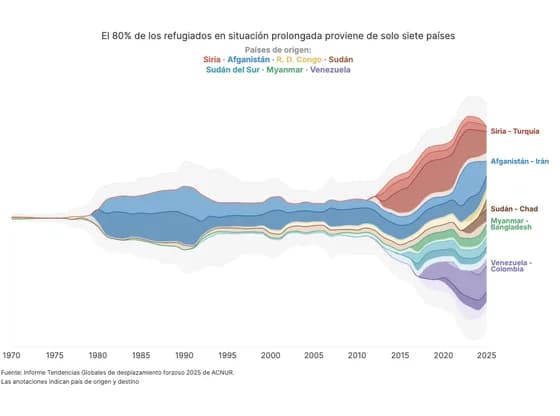 Line, bar and pie chartsEl 80% de los refugiados en situación prolongada proviene de solo siete países
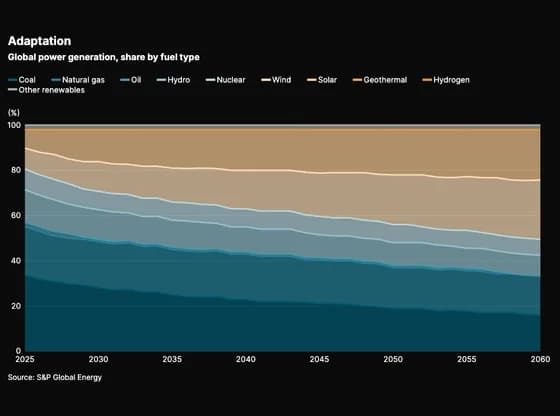 Line, bar and pie chartsAdaptation
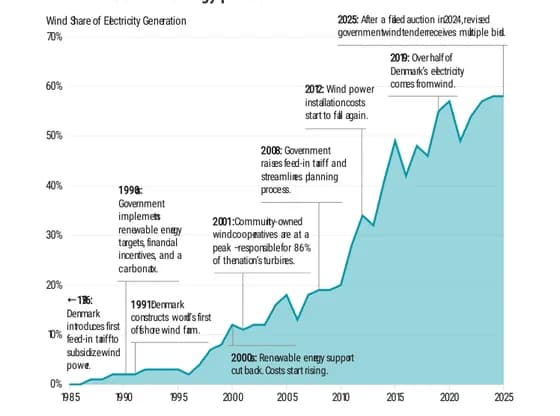 Interactive SVGDenmark is a wind energy pioneer
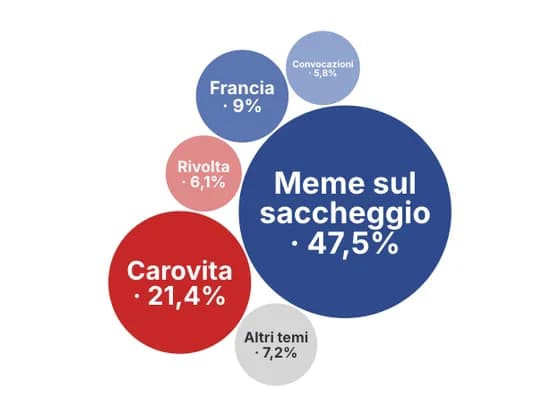 Distribution chartsIl passaparola che ha portato i giovani in piazza
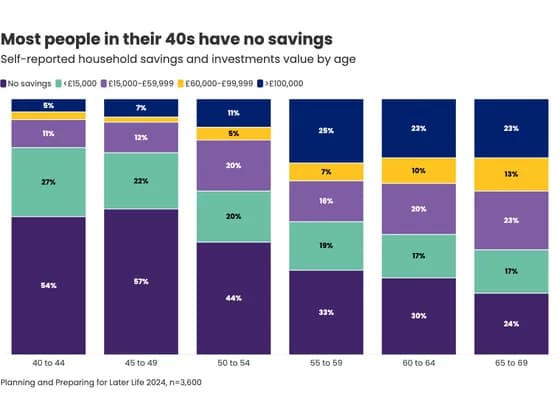 Line, bar and pie chartsMost people in their 40s have no savings
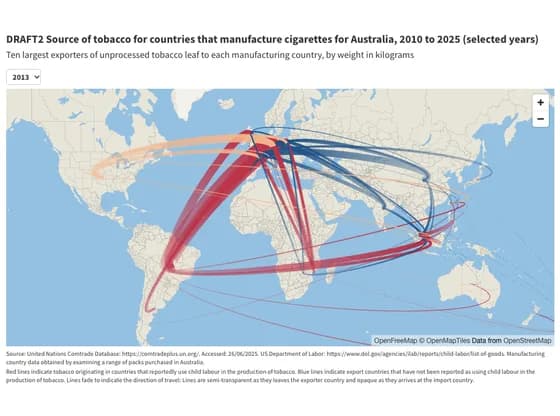 3D mapDRAFT2 Source of tobacco for countries that manufacture cigarettes for Australia, 2010 to 2025…
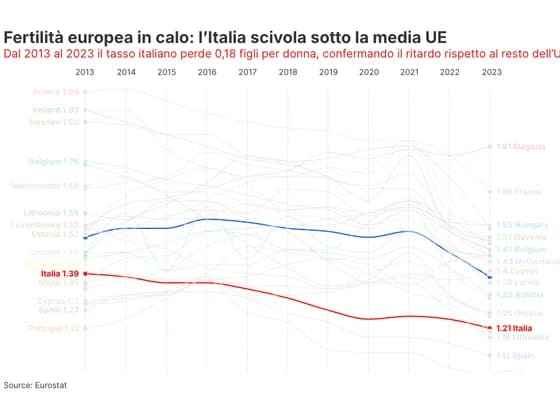 Slope chartFertilità europea in calo: l’Italia scivola sotto la media UE
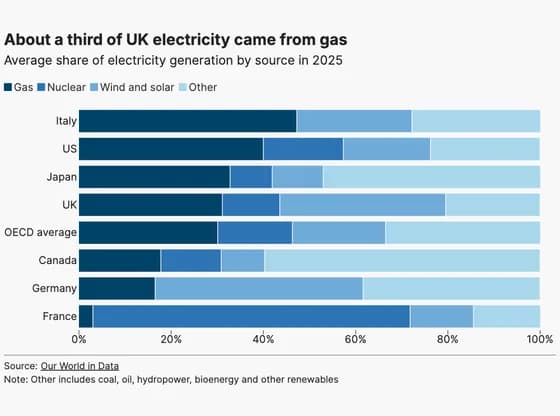 Line, bar and pie chartsAbout a third of UK electricity came from gas
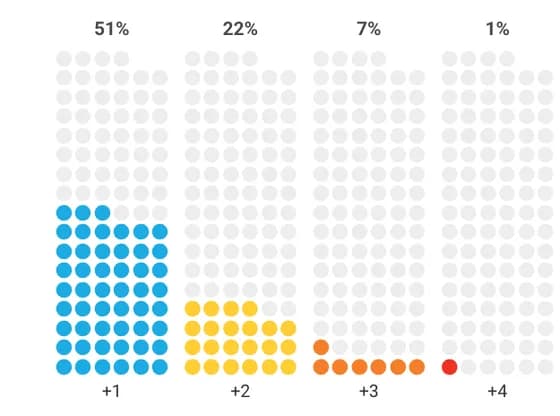 PictogramIf the world wants faster progress, it must focus on the children facing intersecting disadvantages
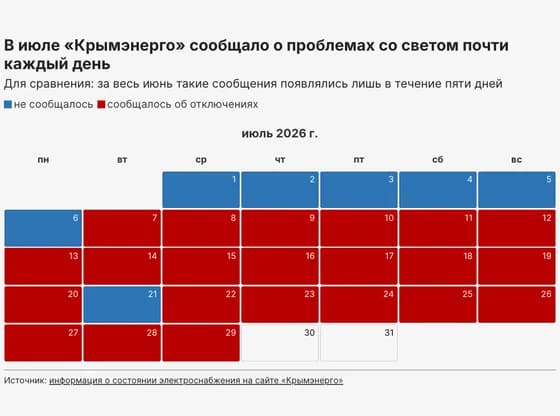 3D plotsВ июле «Крымэнерго» сообщало о проблемах со светом почти каждый день