
这里的每张图表,最初都是一张表格。
地图、柱状图竞赛、矩形树图、象形图等。打开任意一张,换上你自己的数据。
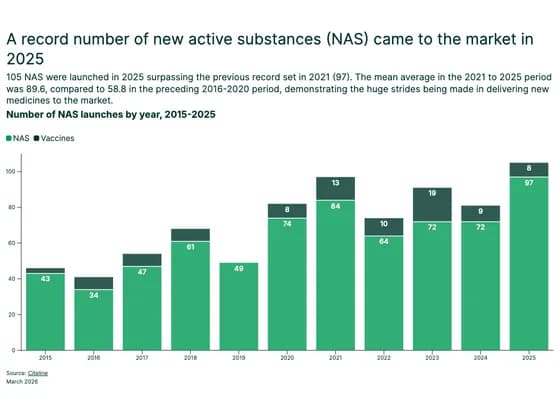 Line, bar and pie chartsA record number of new active substances (NAS) came to the market in 2025
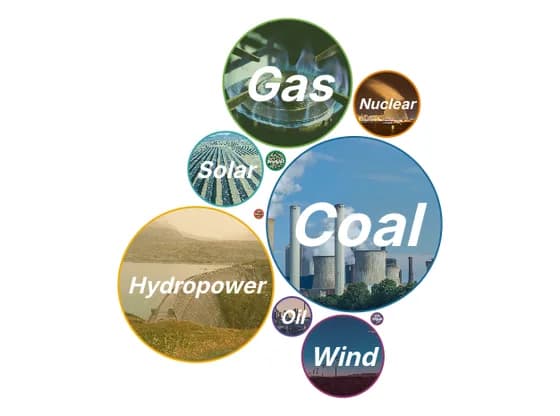 Distribution chartsInstalled capacity of global power plants financed by Chinese foreign direct investment and/or…
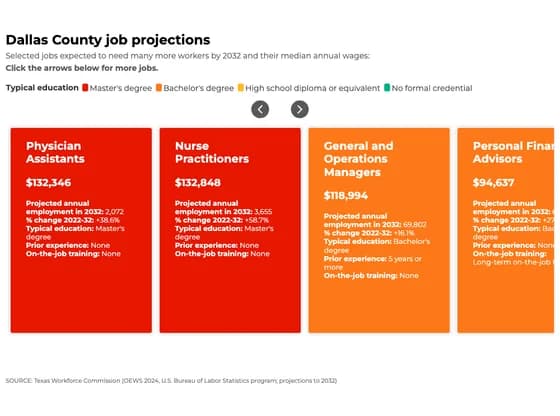 CardsDallas County job projections
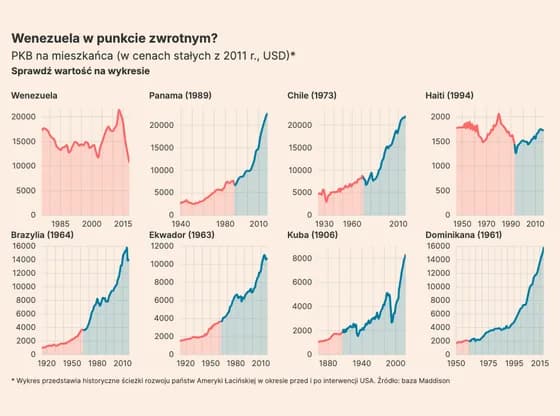 Line, bar and pie chartsWenezuela w punkcie zwrotnym?
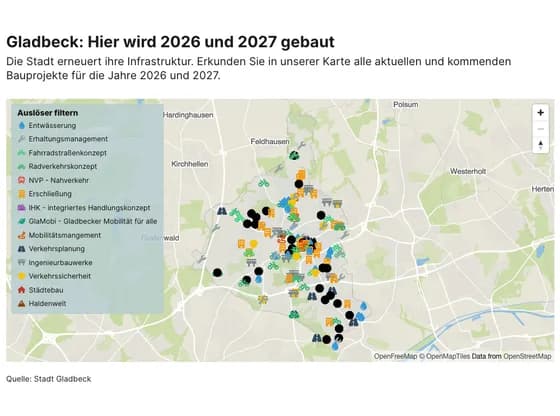 3D mapGladbeck: Hier wird 2026 und 2027 gebaut
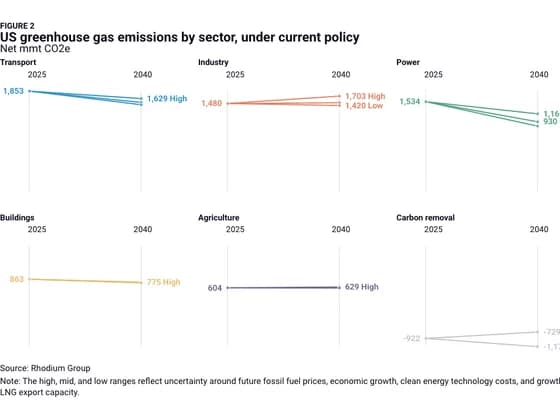 Slope chartFIGURE 2 US greenhouse gas emissions by sector, under current policy
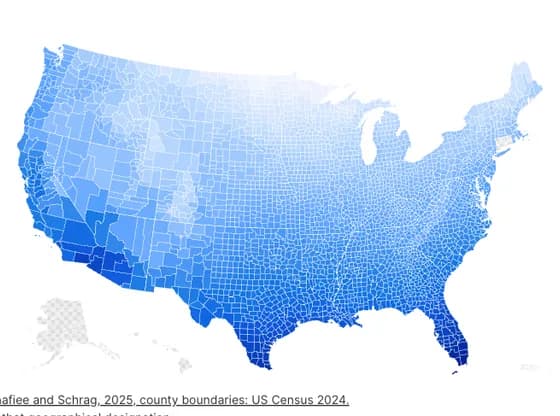 MapsAir-source heat pumps are better at heating in warmer areas
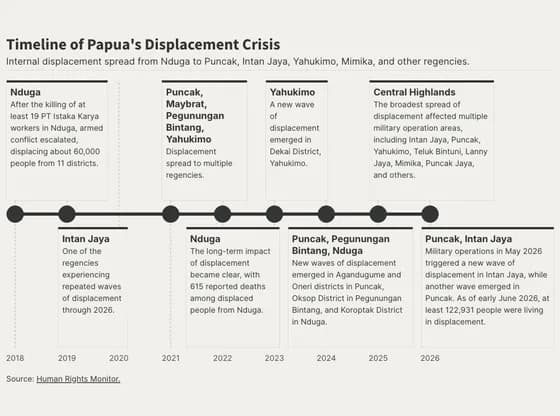 TimelineTimeline of Papua's Displacement Crisis
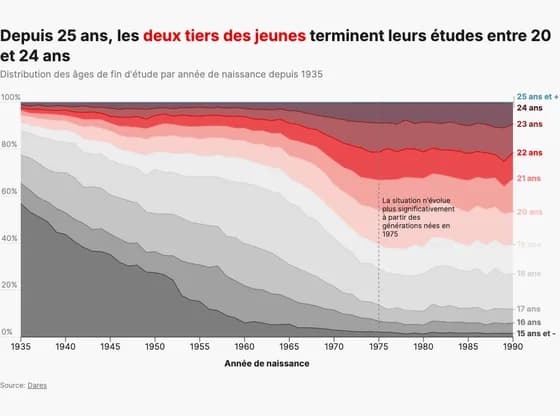 Line, bar and pie chartsDepuis 25 ans, les deux tiers des jeunes terminent leurs études entre 20 et 24 ans
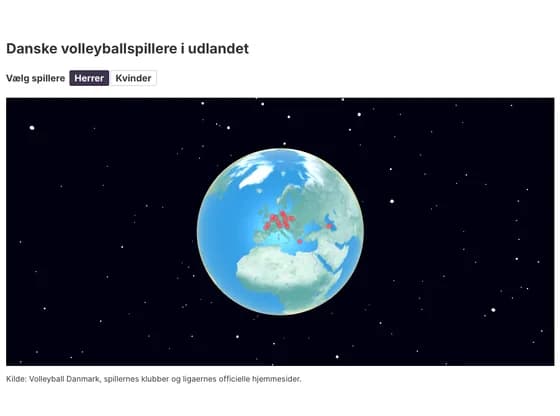 3D globeDanske volleyballspillere i udlandet
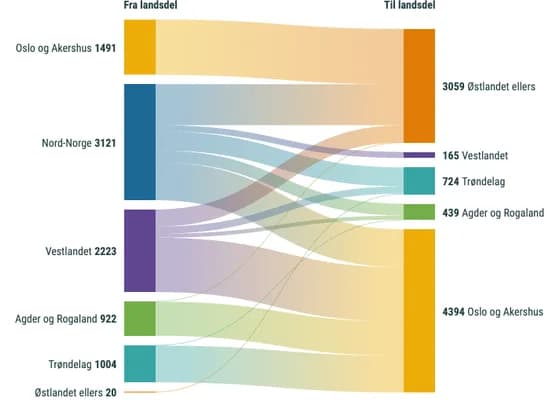 Sankey diagramÅrlige nettoflyttinger mellom landsdeler. Gjennomsnitt 2010-2026
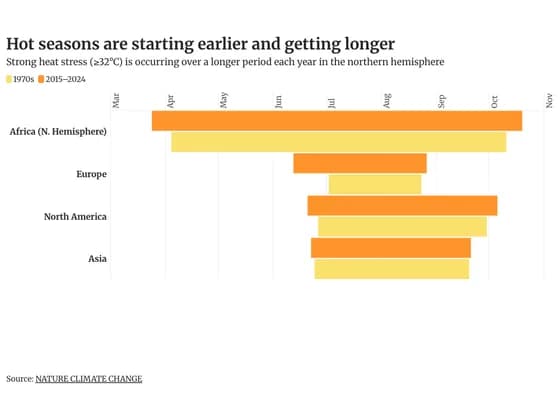 Gantt chartHot seasons are starting earlier and getting longer
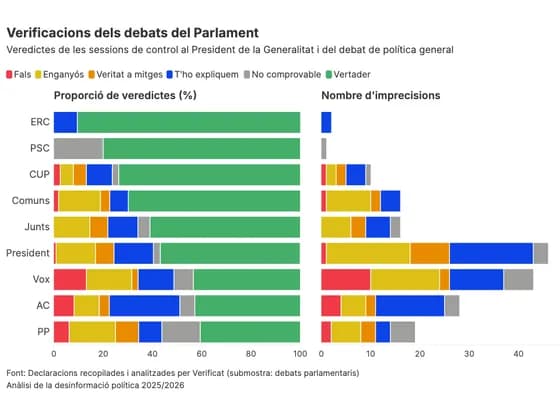 Line, bar and pie chartsVerificacions dels debats del Parlament
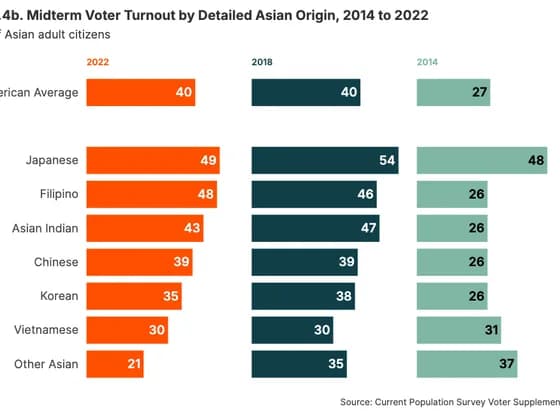 Line, bar and pie chartsFigure 9.4b. Midterm Voter Turnout by Detailed Asian Origin, 2014 to 2022
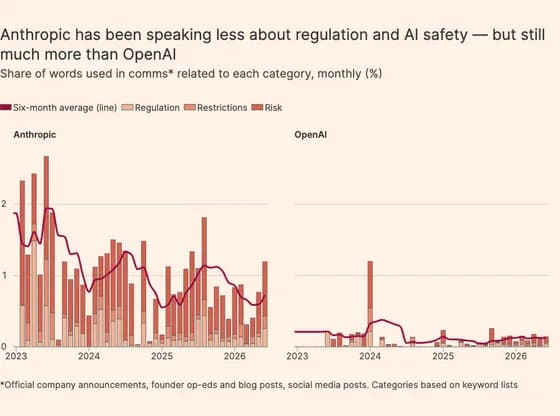 Line, bar and pie chartsAnthropic has been speaking less about regulation and AI safety — but still much more than OpenAI
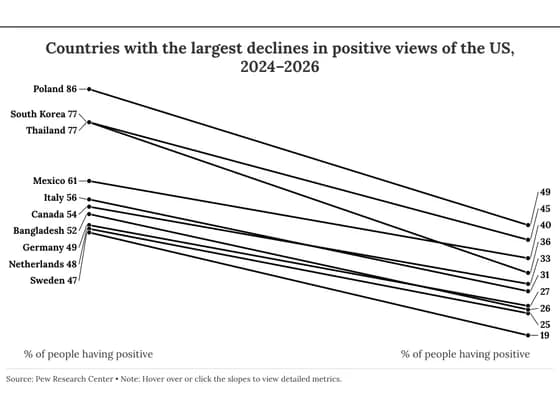 Slope chartCountries with the largest declines in positive views of the US, 2024–2026
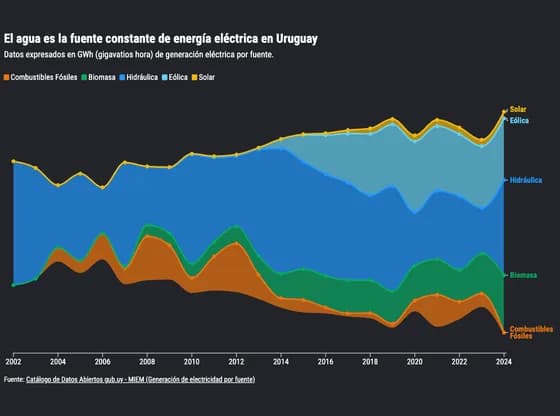 Line, bar and pie chartsEl agua es la fuente constante de energía eléctrica en Uruguay
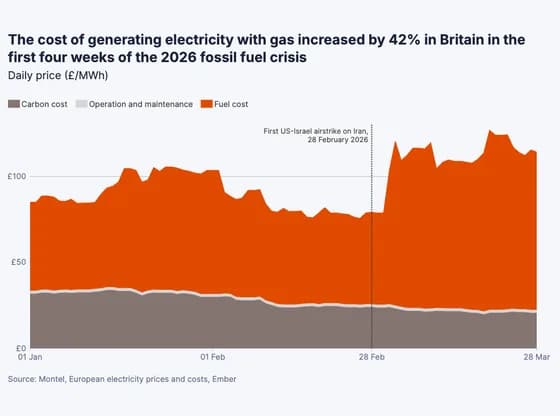 Line, bar and pie chartsThe cost of generating electricity with gas increased by 42% in Britain in the first four weeks…
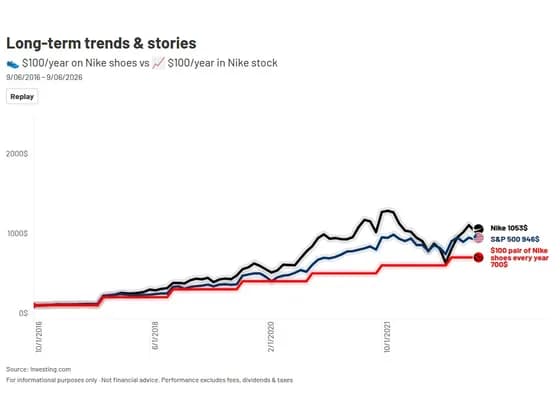 Animated chartsLong-term trends & stories
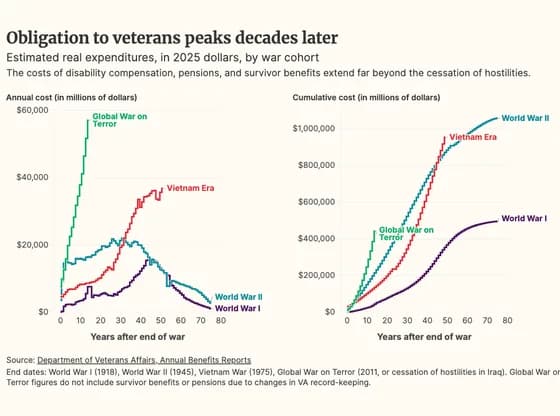 Line, bar and pie chartsObligation to veterans peaks decades later