
PlotSet LogoPlotSet
模板

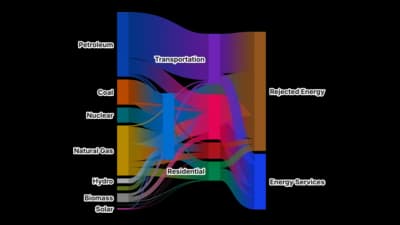
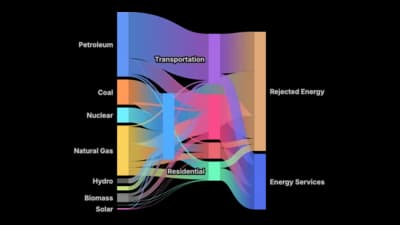
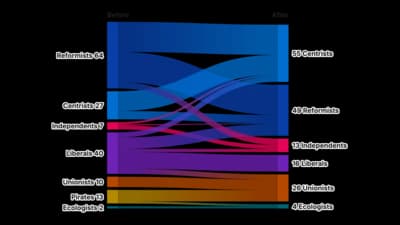
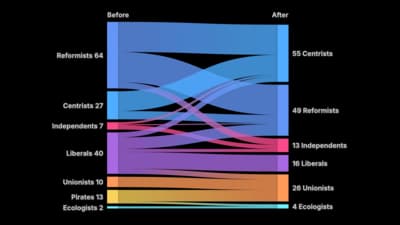
桑基图

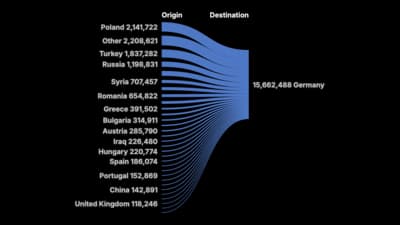
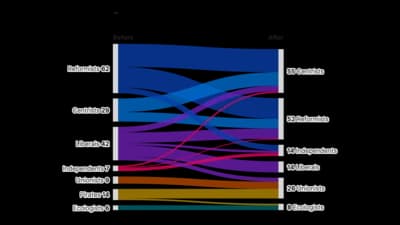
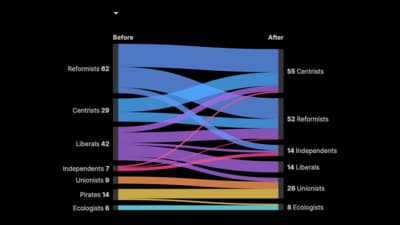
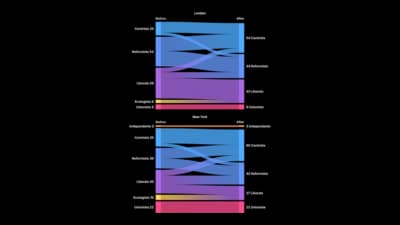
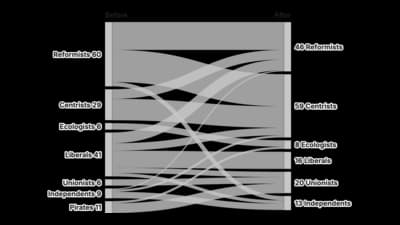
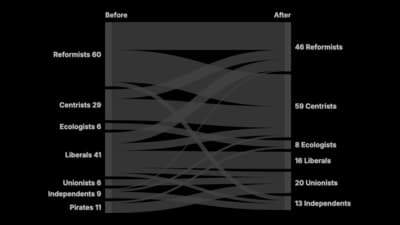
用带状宽度展示有多少从一个阶段流向下一个阶段。

模板

从以下任一模板开始,换上你自己的数据即可。

什么是 桑基图?

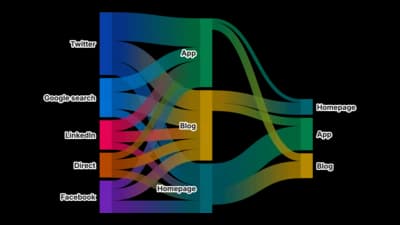
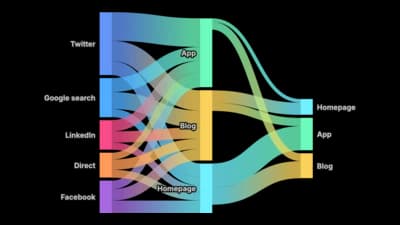
A Sankey diagram shows flow. Nodes represent stages or categories, links represent movement between them, and the width of every link is proportional to the quantity moving along it. Because widths are conserved from one stage to the next, the diagram enforces its own arithmetic: whatever enters a node must leave it. That is what makes a Sankey good at questions of the form "where did it all go?", and why energy budgets, website journeys and money flows are its classic subjects.

什么时候使用 桑基图

  • You are tracing a quantity through stages

    Visitors from channel to page to outcome, energy from source to use, revenue from segment to cost to profit. The subject is movement, not comparison.

  • The losses matter as much as the gains

    A Sankey shows the branch that drops away just as clearly as the one that continues, which makes it unusually honest about drop-off.

  • Your data has a source, a target and an amount

    That three-column shape is exactly what the diagram consumes. If your spreadsheet already looks like that, this is probably the chart you want.

  • You have two or three stages

    Two stages show a split, three show a journey. That is where a Sankey stays readable.

什么时候不该用 桑基图

  • Nothing actually flows

    A Sankey asserts that a quantity moves from one node to another. Using it for unrelated categories borrows a sense of causation that the data does not support.

  • You need to read precise values

    Link widths are compared by eye, and thin links are almost unreadable. If exact numbers matter, put them in a table beside the diagram.

  • You have many nodes and many links

    Past roughly a dozen nodes the crossings dominate and the diagram becomes decorative. Aggregate the small flows into a named group first.

  • You are showing a simple breakdown of one total

    A single total split once is a bar or a donut. A Sankey earns its complexity only when there is a second stage.

如何制作 桑基图

从电子表格到已发布的图表,一步一步来。

  1. 01Start from the Sankey template
  2. 02Shape your data as source, target, value
  3. 03Upload or connect your data
  4. 04Aggregate the small flows
  5. 05Publish, embed or export

桑基图 的组成部分

Node
A stage or category. Its height is the total flowing through it, so nodes are sized by the data rather than chosen by you.
Link (flow)
Movement from one node to another. Width is proportional to quantity, and width is the only thing encoding the value.
Stage (column)
A vertical band of nodes at the same depth in the flow. Reading left to right follows the quantity forward through the process.
Conservation
The rule that what enters a node must leave it. It is what lets a reader trust the widths, and what makes an unbalanced Sankey obviously wrong.
Terminal node
Where flow stops: converted, lost, or left over. Naming these honestly is usually where the insight is.
Link colour
Normally inherited from the source or target node, to help the eye follow one path through the crossings.

桑基图 的常见错误

Flows that do not balance

If the totals entering and leaving a node differ, the widths are lying. Reconcile the numbers before plotting, and add an explicit "unaccounted" flow if some quantity genuinely goes missing.

Too many nodes

A Sankey with forty nodes is a picture of complexity rather than an explanation of it. Aggregate first, and keep the nodes a reader can name.

Hiding the drop-off

Leaving out the flow that ends in nothing makes the process look more efficient than it is. The branch that stops is usually the most useful part of the diagram.

Using it for a single split

One stage of division is a bar chart. Reaching for a Sankey there adds visual complexity without adding information.

桑基图:常见问题

Showing how a quantity flows between stages. Link widths are proportional to the amount moving, so you can see both the main paths and where quantity drops away.

立即制作你的 桑基图

免费开始,600 多个模板,无需信用卡。