PlotSet LogoPlotSet
模板

热力图

用颜色编码的网格,让大型表格中的规律清晰可见。

模板

从以下任一模板开始,换上你自己的数据即可。

什么是 热力图?

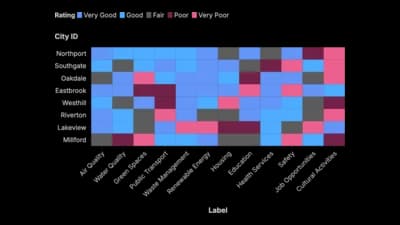
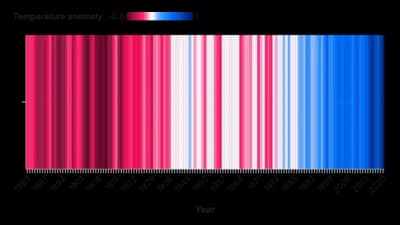
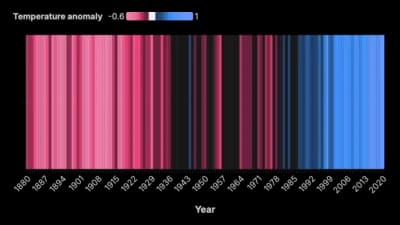
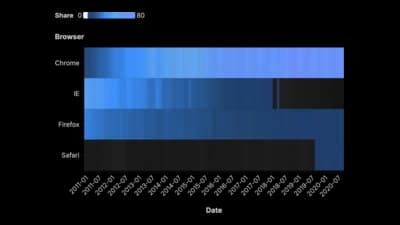
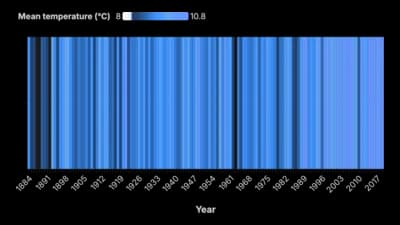
A heatmap is a grid where colour stands in for value. Rows and columns are the two things you are crossing, such as hours against days, products against regions, or variables against themselves, and every cell is shaded by the number where they meet. It exists because a table of four hundred numbers is unreadable and a bar chart of four hundred bars is worse. Colour is a weak encoding for a single value, but it is unmatched at revealing structure across many at once: the busy afternoon, the underperforming region, the block of variables that all move together.

什么时候使用 热力图

  • You are crossing two categorical variables

    Day against hour, channel against month, product against store. Two axes of categories and one number at each intersection is exactly the shape a heatmap consumes.

  • The pattern matters more than any single cell

    Where the hot band sits, which row is consistently pale, whether the diagonal stands out. Heatmaps answer shape questions, not lookup questions.

  • You have a correlation matrix

    Variables against themselves with a diverging colour scale is the standard way to read a correlation matrix, and one of the few cases where the chart is genuinely the fastest route to the answer.

  • There is too much data for anything else

    Hundreds of cells fit in a screen-sized grid. No other chart type carries that much data at that density and stays readable.

什么时候不该用 热力图

  • Readers need the actual numbers

    Nobody decodes a shade back into a value accurately. If the figures will be quoted, print them in the cells or use a table.

  • One axis is continuous time you want to trace

    Following a line across a series of colour blocks is much harder than following a line. If the question is "what is the trend", draw a line chart.

  • The values are nearly identical

    A grid of almost the same colour is a picture of nothing. Check the range before you build; if it is narrow, a heatmap will imply differences that are noise.

  • Your audience may not see colour the same way

    Colour is the entire encoding here, so there is no fallback. Use a perceptually uniform, colour-blind-safe scale, and never red-green.

如何制作 热力图

从电子表格到已发布的图表,一步一步来。

  1. 01Start from the heatmap template
  2. 02Shape your data as row, column and value
  3. 03Upload or connect your data
  4. 04Choose the right colour scale
  5. 05Order the rows and columns deliberately

热力图 的组成部分

Cell
One intersection of a row and a column, shaded by its value. The unit of the chart, and the thing a tooltip should always explain.
Row and column labels
The two categorical axes. Their order is a design decision, not a given, and it does more for legibility than any colour choice.
Colour scale
The mapping from number to shade. Sequential runs light to dark; diverging runs from one hue through a neutral midpoint to another.
Legend
The only way a reader can convert a shade back into a number. A heatmap without one is decorative.
Scale range
Where the colour scale starts and stops. Clipping it exaggerates differences; letting one outlier set the maximum flattens everything else into a single tone.
Missing cell
A combination with no data. Give it its own visible treatment so it does not read as a low value.

热力图 的常见错误

A rainbow colour scale

Spectral scales are not perceptually ordered, so readers see boundaries where the data is smooth. Use a single-hue or a proper diverging scale.

Letting one outlier set the range

A single extreme value pushes every other cell into the bottom of the scale and the grid goes flat. Cap the scale, or transform the values, and say which you did.

Alphabetical rows

Ordering by name scatters similar rows across the grid and hides the structure the chart exists to show. Sort by value or cluster.

Red-green for good and bad

The most common pairing is also the least accessible. Blue-orange carries the same meaning and survives the most common forms of colour blindness.

热力图:常见问题

Showing the value of one number across two categorical dimensions at once: days against hours, products against regions, or variables against themselves in a correlation matrix.

立即制作你的 热力图

免费开始,600 多个模板,无需信用卡。