PlotSet LogoPlotSet
模板

仪表盘

用表盘和进度条展示距离目标的进展。

模板

从以下任一模板开始,换上你自己的数据即可。

什么是 仪表盘?

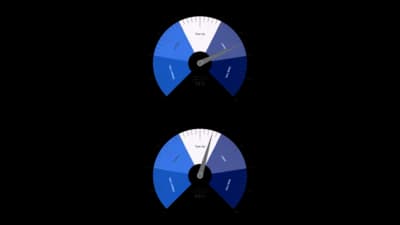
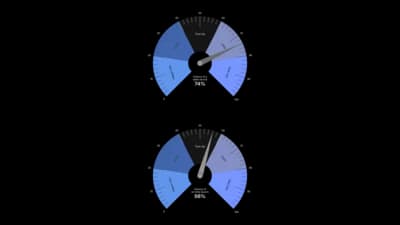
A gauge chart reads a single number against a fixed range, the way a speedometer does. The value is drawn as an arc that fills from the minimum toward the maximum, with the number in the middle and an optional marker for the target. Give it several rows and it lays out a grid of gauges, so a small KPI board fits on one canvas. Coloured bands can mark poor, fair and good ranges, and a needle can point at the value. The range is a setting rather than data, so every gauge is judged against the same frame.

什么时候使用 仪表盘

  • You have a handful of KPIs

    Up to about eight gauges make a readable dashboard in one embed.

  • Each number has a natural range

    Percentages, scores and utilisation figures fit a fixed scale from zero to a maximum.

  • Readers expect a dashboard look

    A gauge is instantly familiar, which helps when the audience is not used to charts.

  • You want a target marker

    A mark on the arc shows how far each value is from where it should be.

什么时候不该用 仪表盘

  • You have many KPIs

    A gauge spends a lot of ink on one number. Past a handful, a bullet chart says the same in less space.

  • Comparing against targets is the point

    A bullet chart or a bar chart makes close comparisons easier than arcs do.

  • Values have no fixed range

    A gauge needs a minimum and maximum that mean something.

  • You need to show change over time

    A gauge shows one moment. Use a line chart for a trend.

如何制作 仪表盘

从电子表格到已发布的图表,一步一步来。

  1. 01Open the Gauge template
  2. 02Add your values
  3. 03Set the scale
  4. 04Add bands and a needle
  5. 05Shape the arc
  6. 06Publish and embed

仪表盘 的组成部分

Track
The grey arc showing the full range from minimum to maximum.
Value arc
The dark arc that fills up to the value.
Value
The large number in the middle of the gauge.
Label
The metric name under the value.
Target marker
A short line across the arc at the target.
End labels
The minimum and maximum at each end of the arc.

仪表盘 的常见错误

Using too many gauges

Each gauge shrinks as the grid grows. Keep to a handful, or switch to a bullet chart.

Setting a scale that hides the data

A maximum far above every value leaves the arcs nearly empty. Pick a range that fits.

Mixing units

Gauges share one scale, so percentages and counts do not belong on the same board.

Long metric names

Labels are truncated to fit under each gauge. Keep names short.

仪表盘:常见问题

A chart that shows a single value on a fixed arc, like a speedometer, usually with a target and coloured bands.

立即制作你的 仪表盘

免费开始,600 多个模板,无需信用卡。