PlotSet LogoPlotSet
模板

箱线图

用箱体和须线概括数值的分布范围。

模板

从以下任一模板开始,换上你自己的数据即可。

什么是 箱线图?

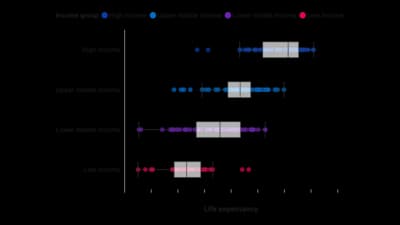
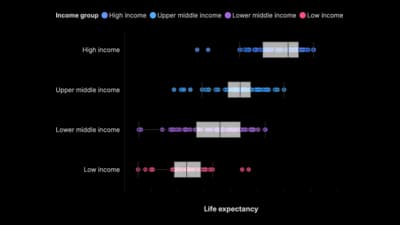
A box plot, a box and whisker plot, is a five-number summary drawn to scale. The box spans the middle half of the data, from the first quartile to the third, with a line inside it at the median. The whiskers reach out to the furthest values still within one and a half times the box's height, and anything past them is drawn as an individual point: an outlier. Because the whole summary takes up a narrow strip, you can stand fifteen of them side by side and compare fifteen distributions at once, their typical values, their spread, their skew and their stragglers, in the space a single histogram would need. John Tukey designed it for exactly that job, and nothing has replaced it.

什么时候使用 箱线图

  • You are comparing several groups

    Salary by department, response time by region, exam scores by school. One box per group, all on the same axis, and the comparison is immediate.

  • Spread matters as much as the average

    Two teams with the same median can be wildly different to work with. The box shows consistency, which a bar chart of averages hides completely.

  • You want outliers named rather than smoothed away

    Box plots plot extreme values individually instead of absorbing them into a bar. That makes them the standard first look before any statistical test.

  • Space is tight and the groups are many

    A dozen histograms need a grid and a lot of page. A dozen boxes fit on one axis and still support a real comparison.

什么时候不该用 箱线图

  • Your distribution has two peaks

    A box plot cannot show bimodality: two clusters and one broad middle look identical through a five-number summary. If you suspect two populations are mixed, use a histogram or a violin plot.

  • You have very few observations

    Below roughly ten values per group, quartiles are unstable and the box is theatre. Plot the individual points instead; with twenty points a strip plot is more honest and just as readable.

  • Your audience has never read one

    The box is not a bar and the whiskers are not error bars. For a general readership, either explain the parts in the caption or fall back to a histogram, a dot plot or a simple ranking.

  • You are showing one distribution to a lay reader

    For a single group, a histogram tells a fuller story with less to learn. Box plots earn their keep when there are groups to compare.

如何制作 箱线图

从电子表格到已发布的图表,一步一步来。

  1. 01Start from the box plot template
  2. 02Bring raw values, one row per observation
  3. 03Upload or connect your data
  4. 04Order the boxes deliberately
  5. 05Decide what to do with the outliers
  6. 06Publish, embed or export

箱线图 的组成部分

Median
The line inside the box: half the values sit above it, half below. Its position within the box is the quickest read on skew: a median hugging the bottom means a long tail upward.
Box (interquartile range)
From the first quartile to the third, so the box holds the middle 50 per cent of the data. Its height is the IQR, and it is the chart's measure of spread.
Whiskers
The lines out to the most extreme values still within 1.5 times the IQR of the box. That 1.5 is a convention, not a law, which is why the caption should say which one you used.
Outliers
Individual points beyond the whiskers. They are not errors by default: an outlier is a value the rest of the data did not predict, and it is often the reason the chart is worth drawing.
Quartiles
The 25th and 75th percentiles that form the ends of the box. Together with the median and the two whisker ends they make Tukey's five-number summary.
Category axis
One slot per group. Its order is a design decision: sorting by median turns a set of summaries into a comparison the reader can follow left to right.

箱线图 的常见错误

Not saying what the whiskers mean

Some tools draw whiskers to 1.5 times the IQR, others to the minimum and maximum, others to the 5th and 95th percentiles. The three look identical and mean different things, so state the rule in the caption.

Using a box plot on a bimodal distribution

The five-number summary averages the two peaks into one wide box and shows nothing of the split. Check the shape with a histogram before you commit to boxes.

Deleting outliers to tidy the chart

The points beyond the whiskers are usually the most informative part of the picture. Investigate them, annotate them, and only remove them when you can say why they are not real.

Reading the box as a confidence interval

The box describes the data you have, not the uncertainty around the median. Overlapping boxes are not a significance test, and non-overlapping ones are not proof of one.

Leaving the groups in alphabetical order

The comparison is the point of the chart. Sorting by median costs one setting and makes the pattern visible instead of leaving the reader to hunt for it.

箱线图:常见问题

Comparing the distribution of a numeric variable across several groups at once: their medians, their spread, their skew and their outliers, in far less space than a set of histograms would take.

立即制作你的 箱线图

免费开始,600 多个模板,无需信用卡。