PlotSet LogoPlotSet
模板

条形图

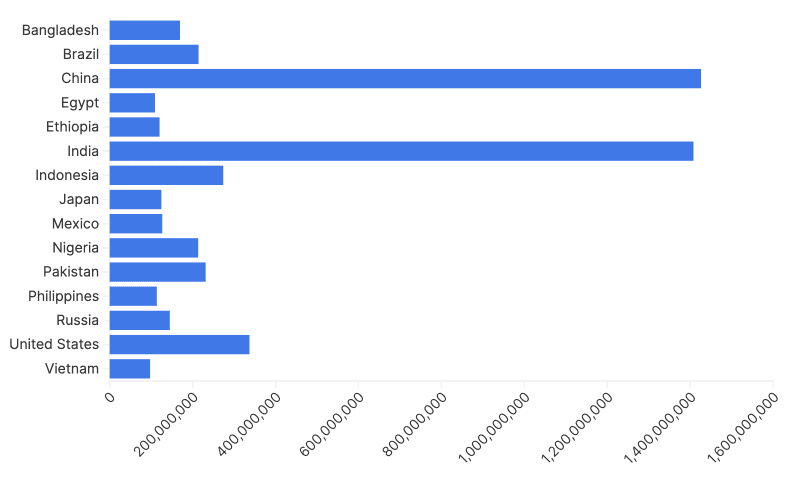
用条形和柱形比较各类别的大小。

模板

从以下任一模板开始,换上你自己的数据即可。

什么是 条形图?

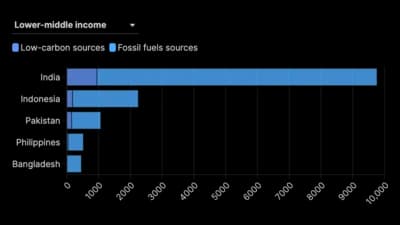
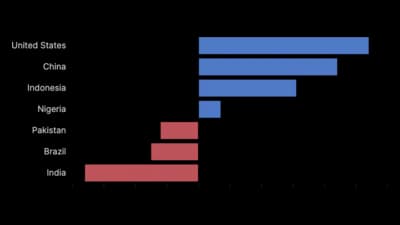
A bar chart represents each category as a bar whose length is proportional to its value, with all bars starting from a common baseline. That shared baseline is the whole point: length from a fixed zero is the most accurately read visual encoding there is, which is why a bar chart is the safe default for almost any category-versus-value comparison. When you are unsure which chart to use, this is usually the right answer.

什么时候使用 条形图

  • You are comparing values across categories

    Revenue by country, headcount by department, votes by party. One bar per category, one number per bar, no ambiguity.

  • You want a ranking

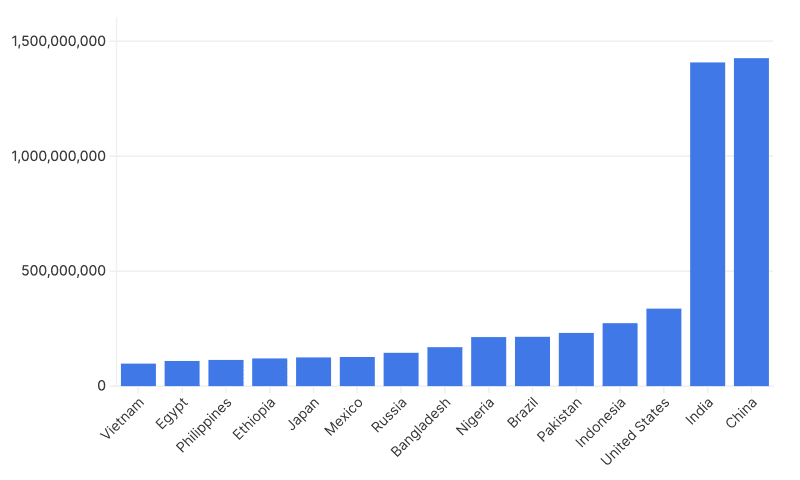
    Sorted bars turn a table into an ordered picture. The reader sees first, last and the gaps between them without reading a single number.

  • The differences are small and still matter

    Because bars share a baseline, a few percent difference is visible and trustworthy. Pies and donuts cannot do this.

  • Your category names are long

    Horizontal bars give long labels a full line each, with no rotating or truncating. This alone makes bars better than columns for most real-world category names.

什么时候不该用 条形图

  • You are showing a continuous trend over time

    Many time periods read better as a line, which makes the shape of the change visible. Bars over time work only for a handful of periods.

  • You need to show the parts of each total

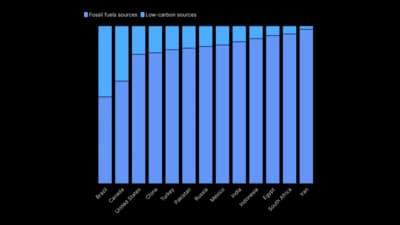
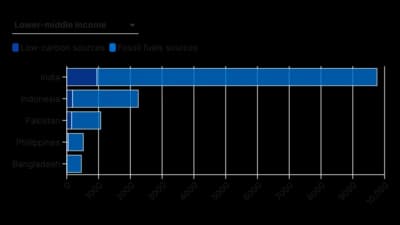
    One bar carries one number. If each category breaks into segments, use a stacked bar chart, or grouped bars if the segments need precise comparison.

  • You have hundreds of categories

    Four hundred bars is a texture, not a chart. Filter to a meaningful top group, or move to a distribution chart such as a histogram.

  • You cannot start the axis at zero

    Bar length is the encoding. If your data genuinely needs a non-zero baseline, use a dot plot or a line chart, where position rather than length carries the value.

如何制作 条形图

从电子表格到已发布的图表,一步一步来。

  1. 01Start from the bar chart template
  2. 02Prepare a category column and a value column
  3. 03Upload or connect your data
  4. 04Sort, label and keep one colour
  5. 05Publish, embed or export

条形图 的组成部分

Category axis
The axis listing what you are comparing. Horizontal bars put it on the left, which is where long labels belong.
Value axis
The numeric scale the bar lengths are measured against. It must start at zero, because length from zero is what encodes the value.
Bar
One category. Its length is the value; its width is meaningless and should be identical for every bar.
Gap
The space between bars. Roughly half a bar width reads well: too little and the chart looks like a histogram, too much and the comparison gets harder.
Value label
The number printed at the end of each bar. Adding it removes the need to read against gridlines and usually lets you drop the gridlines entirely.
Sort order
Ranked by value, or by the categories' own natural order. Unsorted bars make the reader do work the chart should have done.

条形图 的常见错误

Truncating the value axis

Starting the axis above zero breaks the length encoding and exaggerates every difference on the chart. This is the single most common way a bar chart misleads.

Giving every bar a different colour

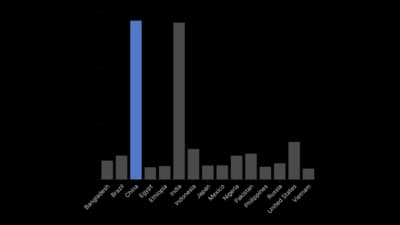
With one series, colour encodes nothing. Use one colour, and reserve a second only to highlight the bar you are actually talking about.

Leaving the bars unsorted

Alphabetical or spreadsheet order hides the ranking that the chart exists to show. Sort by value unless there is a real reason not to.

Rotating long category labels

Diagonal text is hard to read. Switch to horizontal bars and the labels sit flat on one line each.

条形图:常见问题

Comparing a single value across categories. Each bar's length encodes its value from a shared zero baseline, which makes it the most accurately read of the common charts.

立即制作你的 条形图

免费开始,600 多个模板,无需信用卡。