| Origin | Origin lat | Origin lng | Destination | Destination lat | Destination lng | Passengers (000s) | Region |
|---|---|---|---|---|---|---|---|
| London | 51.5074 | -0.1278 | New York | 40.7128 | -74.0060 | 620 | Transatlantic |
| London | 51.5074 | -0.1278 | Dubai | 25.2048 | 55.2708 | 550 | Europe-Middle East |
| London | 51.5074 | -0.1278 | Singapore | 1.3521 | 103.8198 | 480 | Europe-Asia |
| Tokyo | 35.6762 | 139.6503 | Los Angeles | 34.0522 | -118.2437 | 410 | Transpacific |

How to Create an Arc Map
A step by step walkthrough for turning a sheet of origins and destinations into a published arc map in PlotSet, from placing coordinates to filtering, publishing and embedding.
Environ 8 minutesOne curved line per route, drawn across a world map from your own origins and destinations: that is how to create an arc map from a spreadsheet, with thickness showing volume, colour showing a category, and a filter so viewers can isolate one group. It runs through the same click path any published PlotSet chart takes, with your own routes rather than placeholder rows.
If your sheet already has latitude and longitude for both ends of every route, it takes about eight minutes. Allow longer if you only have place names, since the template needs coordinates and looking them up is the one chore an arc map adds.
Les données dont vous avez besoin
One row per route with six required columns: origin name, origin latitude, origin longitude, destination name, destination latitude, destination longitude. Optional columns add arc size, a colour category and a filter group.
Use decimal degrees. Latitude runs from -90 to 90 and longitude from -180 to 180; southern and western places are negative.
Do not swap the columns. If a route lands in the ocean or on the wrong continent, latitude and longitude are almost always reversed.
Keep coordinates as plain numbers with no degree symbols or N/S suffixes, or the row cannot be placed.
The size column should be numeric. The colour and filter columns are text categories, so keep the spelling consistent or one group will split in two.
Les étapes
Le parcours exact dans PlotSet, d'un modèle vierge à un graphique terminé.
- 01
Open the Arc Map template
From the PlotSet dashboard, start a new project and choose Arc Map, listed under Maps. It loads with sample world air routes already bound, so you can see the column layout before using your own file.

Chaque guide commence ici. Choisissez la catégorie, puis le modèle : c'est la même grille quel que soit le type de graphique visé. - 02
Arrange one route per row
Put the origin and destination names and coordinates on the same row. If you only have city names, look up their coordinates first and add them as columns.
- 03
Upload the file, or connect it live
Import a CSV or .xlsx file from the data panel, paste rows from a spreadsheet, or connect a Google Sheet so the map can be refreshed later. The first row is read as the column headers.

La vue données, ici sur un projet de graphique en barres. Importez un CSV, extrayez les chiffres d'une image avec 'Magic Import' ou synchronisez une Google Sheet. Le panneau est identique pour tous les types de graphique. - 04
Bind the columns
Confirm which columns are the origin, destination and coordinates. Then bind the optional size column to arc thickness, the category column to colour, and a filter column if you want viewers to isolate a group.

Les associations déterminent quelle colonne devient l'étiquette, laquelle fournit les valeurs et laquelle pilote la couleur. 'Auto Binding' les devine à partir de vos en-têtes : vérifiez-les plutôt que de les tenir pour acquises. - 05
Pick a projection and base map
Open the Map tab to choose a flat Mercator view or a rotatable globe, and a light, dark or muted base map. A quiet base makes the arcs stand out.

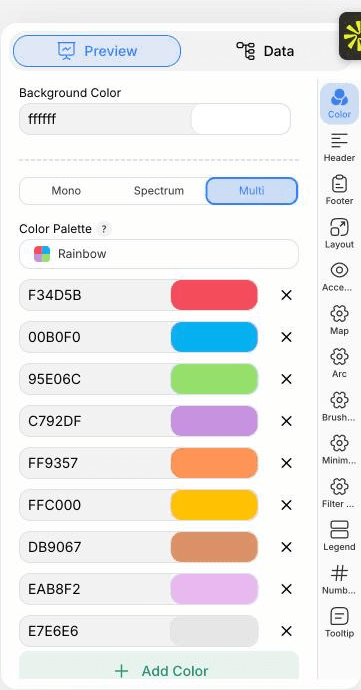
L'onglet 'Preview' pour un graphique Arc Map. Tous les réglages de style se trouvent dans le panneau entouré en rouge : apparence, en-tête, pied de page et les options propres à ce type de graphique, chacun dans un onglet distinct. - 06
Style the arcs
In the Arc tab set how curved the routes are, how thickness scales with your size column, and whether colour comes from a category or a gradient. Turn on arrowheads if direction matters.
- 07
Add the filter and legend
Enable the filter control to show a dropdown or buttons, and place the legend so the colour categories are explained.
- 08
Publish it, embed it, or export it
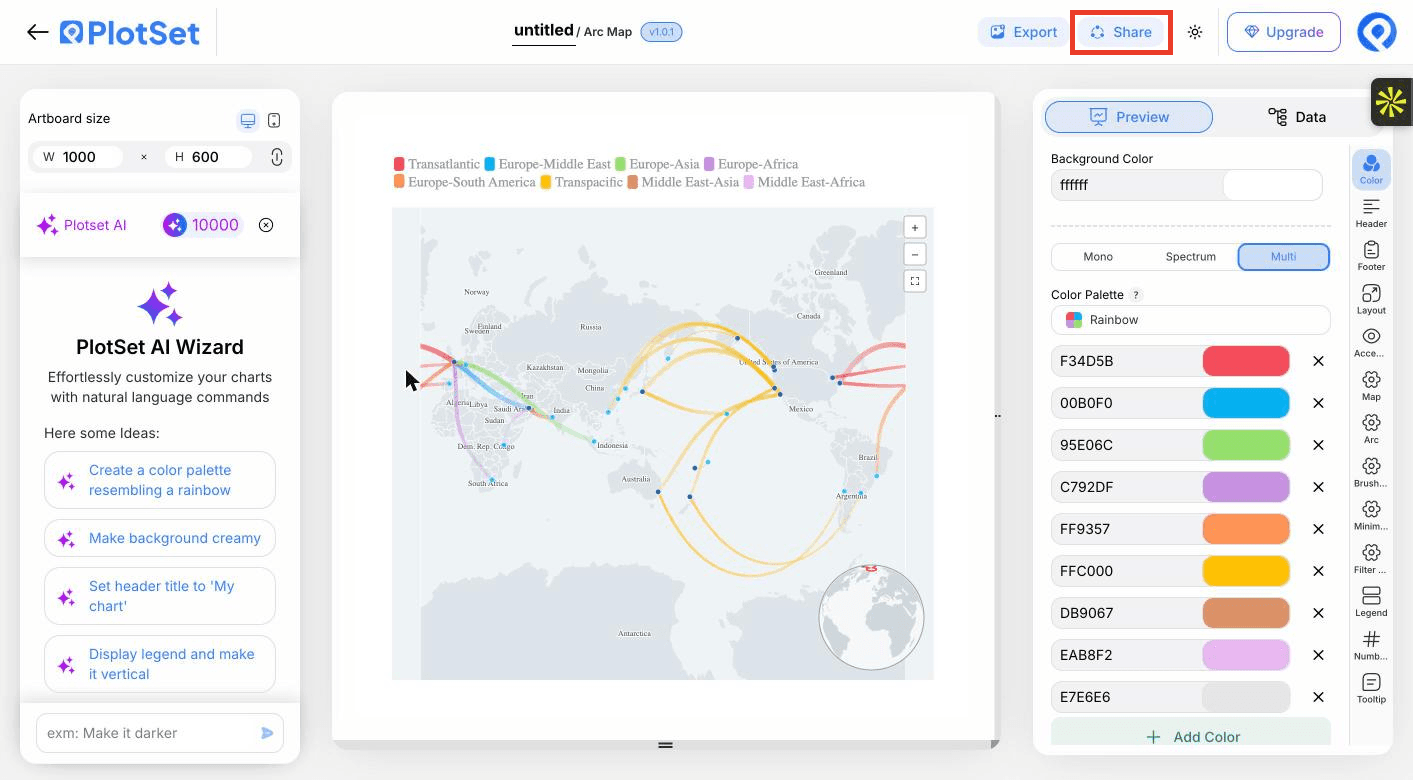
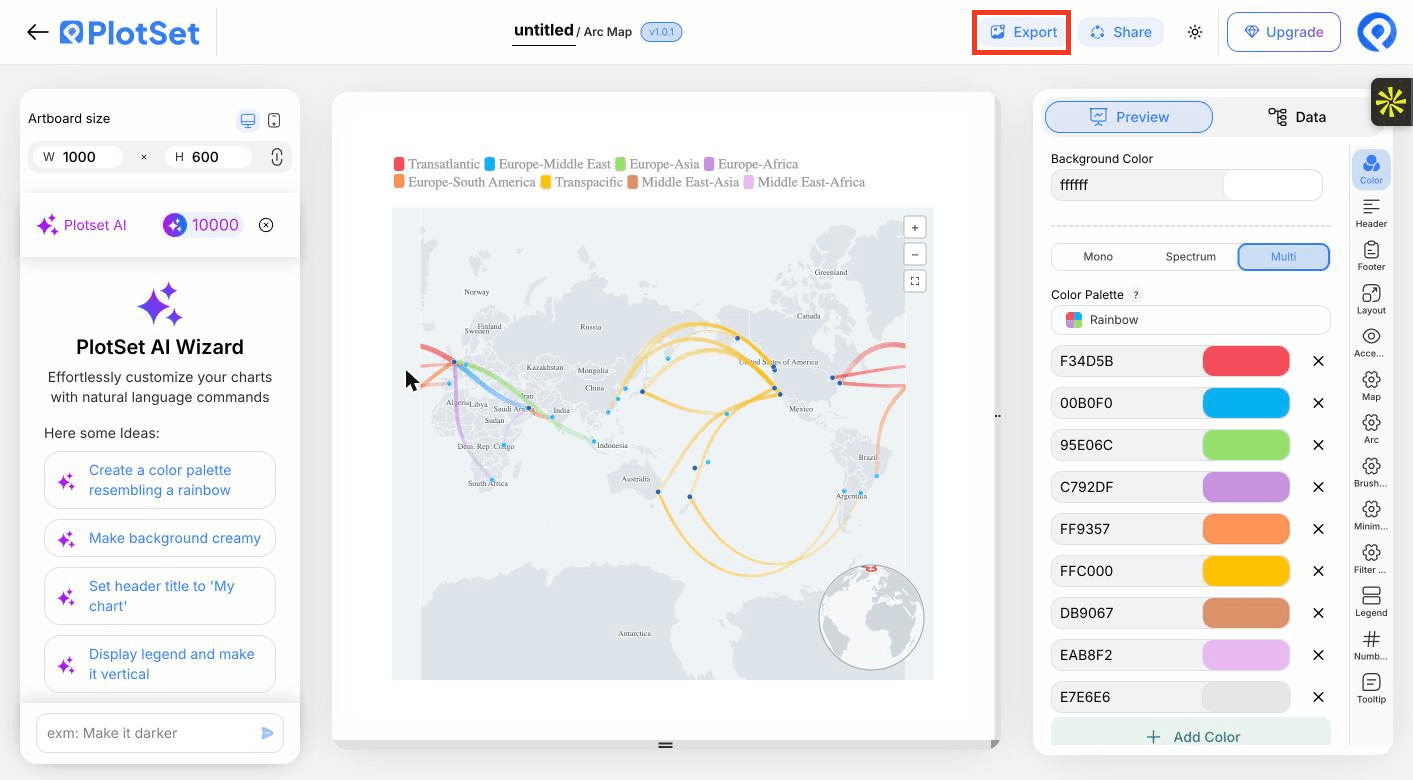
Publish for a live, zoomable map where hovering an endpoint highlights its routes, copy the embed code for your page, or export a PNG, SVG or PDF for a static image.

C'est par 'Share' qu'un graphique terminé devient un lien public et un code d'intégration.
Partez du modèle Arc Map avec des données d'exemple déjà chargées, puis remplacez-les par les vôtres.
Ouvrir le modèleConseils de style pour un Arc Map
Let thickness carry the value
Scaling arc width by passengers or tonnes shows which routes matter. Choose a square-root or log scale when a few routes dwarf the rest.
Use a muted base map
A pale, low-contrast base keeps attention on the routes. Save dark bases for light arcs.
Filter instead of thinning the data
Rather than dropping routes, give them a group column and let viewers switch between them.
Say what thickness means
Add a line to the header or legend, such as thickness shows passengers in thousands, so nobody reads width as distance.
Erreurs courantes en créant un Arc Map
Routes end up in the ocean
Latitude and longitude are probably swapped. Latitude is the north to south number and must stay between -90 and 90.
Some rows are missing from the map
A coordinate was probably read as text, often from a degree symbol or a stray space. Clean the cell to a plain number and re-upload.
The map is an unreadable tangle
Too many routes at equal weight. Bind a size column, add a filter group, or aggregate to region pairs.
En savoir plus sur le Arc Map
Vous n'êtes pas sûr que le Arc Map soit le bon choix ? Découvrez ce que c'est, quand l'utiliser et quand l'éviter.
Arc Map : questions fréquentes
Origin name, origin latitude and longitude, destination name, and destination latitude and longitude, one route per row. Size, colour and filter columns are optional.
Créez votre Arc Map maintenant
Gratuit pour commencer avec plus de 300 modèles. Aucune carte bancaire requise.