PlotSet LogoPlotSet

How to Create a Marimekko Chart

A step by step walkthrough for turning a segment, subdivision and value spreadsheet into a published Marimekko chart in PlotSet, from shaping the sheet to locking the stack order and exporting.

Environ 8 minutes

Take a spreadsheet shaped as segment, subdivision and value, something like revenue by region and sales channel, and this guide shows how to create a Marimekko chart in PlotSet where the column widths carry as much information as the stacks inside them. You will shape the sheet, upload it, lock the column order and the stacking order, then publish, embed or export the finished chart.

If your data is already three columns, one row per block, this takes about eight minutes, and most of that goes into locking the stacking order so it reads the same in every column rather than fighting the upload. Add another five if you are unpivoting a wide report, one column per channel, into the long format PlotSet expects.


Les données dont vous avez besoin

Three columns, one row per block: the segment name, the subdivision name, then the number. No totals row, no wide pivot table, one header row.

Exemple de CSV
RegionChannelRevenue
North AmericaDirect420000
North AmericaReseller180000
North AmericaOnline90000
EuropeDirect260000
EuropeReseller140000
EuropeOnline70000
Asia PacificDirect150000
Asia PacificReseller110000
Asia PacificOnline95000
Remarques

This is long format: one row per segment-subdivision pair, not one column per subdivision. If your report has a Direct column, a Reseller column and an Online column side by side, restack those into rows before uploading.

Spell each segment name identically on every row. "APAC" on one row and "Asia Pacific" on another reads as two separate segments and splits a total that should be one column.

Delete any totals or subtotals row before uploading. A grand total uploaded as a row becomes a segment of its own and throws off every width.

Keep the value column numeric. A revenue figure stored as text (a stray currency symbol or thousands separator that survived an export) will not sum into the segment total PlotSet uses to calculate column width.

Les étapes

Le parcours exact dans PlotSet, d'un modèle vierge à un graphique terminé.

  1. 01

    Start a new project on the Marimekko Chart template

    From the PlotSet dashboard, start a new project and choose the Marimekko Chart template. It loads with sample data already bound to segment, subdivision and value, so you can see the exact column layout before touching your own file.

    Le sélecteur de modèles de PlotSet : les catégories de graphiques listées à gauche, la grille 'Bar Charts' ouverte et la carte du modèle 'Bar Chart' affichant son bouton 'Select'.
    Chaque guide commence ici. Choisissez la catégorie, puis le modèle : c'est la même grille quel que soit le type de graphique visé.
  2. 02

    Shape your sheet into three columns

    List one row per block: the segment name first (region), the subdivision name second (channel), and the number third (revenue). This is long format, not the wide pivot table most reporting tools export by default, where each channel gets its own column.

  3. 03

    Unpivot a wide report if that is where you are starting

    If your source is a table with one column per subdivision, say a region row with a Direct, Reseller and Online column each, stack those columns into rows instead: one row per region-channel pair, three columns total. A quick copy-paste rebuild handles this faster than it sounds.

  4. 04

    Upload your file or connect a sheet

    Use the data panel to import a CSV or .xlsx file, paste rows directly from a spreadsheet, or connect a Google Sheet so the chart can pick up later edits without a re-upload. PlotSet reads the first row as headers automatically.

    La vue données de l'éditeur PlotSet : une grille de tableur dont les colonnes 'Name', 'Value' et 'Region' sont remplies de chiffres par province canadienne, à côté du panneau 'Data' qui propose l'import d'un CSV, 'Magic Import' et la synchronisation d'une Google Sheet.
    La vue données, ici sur un projet de graphique en barres. Importez un CSV, extrayez les chiffres d'une image avec 'Magic Import' ou synchronisez une Google Sheet. Le panneau est identique pour tous les types de graphique.
  5. 05

    Map the segment, subdivision and value columns

    Confirm which column feeds the column width (segment), which feeds the stack (subdivision), and which feeds the block size (value). Column widths are calculated for you from the segment totals: you never enter a width directly.

    Le panneau de données de PlotSet avec les associations de colonnes mises en évidence : 'Label/time' affecté à la colonne A, 'Values' à la colonne B et 'Filter/color' à la colonne C, et le bouton 'Auto Binding' juste en dessous.
    Les associations déterminent quelle colonne devient l'étiquette, laquelle fournit les valeurs et laquelle pilote la couleur. 'Auto Binding' les devine à partir de vos en-têtes : vérifiez-les plutôt que de les tenir pour acquises.
  6. 06

    Order the columns and lock the stacking order

    Sort columns widest to narrowest so the biggest segment reads first, left to right. Then set the subdivision order once and keep it identical in every column: if Direct sits at the bottom in North America, it needs to sit at the bottom in Europe and Asia Pacific too, or the chart stops being comparable across columns.

  7. 07

    Turn on the top axis and value labels

    Switch on the cumulative top axis so the segment widths are readable instead of just implied by eye. Add value or percentage labels to each block; without them a reader has to estimate two dimensions at once, which is the main thing that makes a Marimekko hard to read.

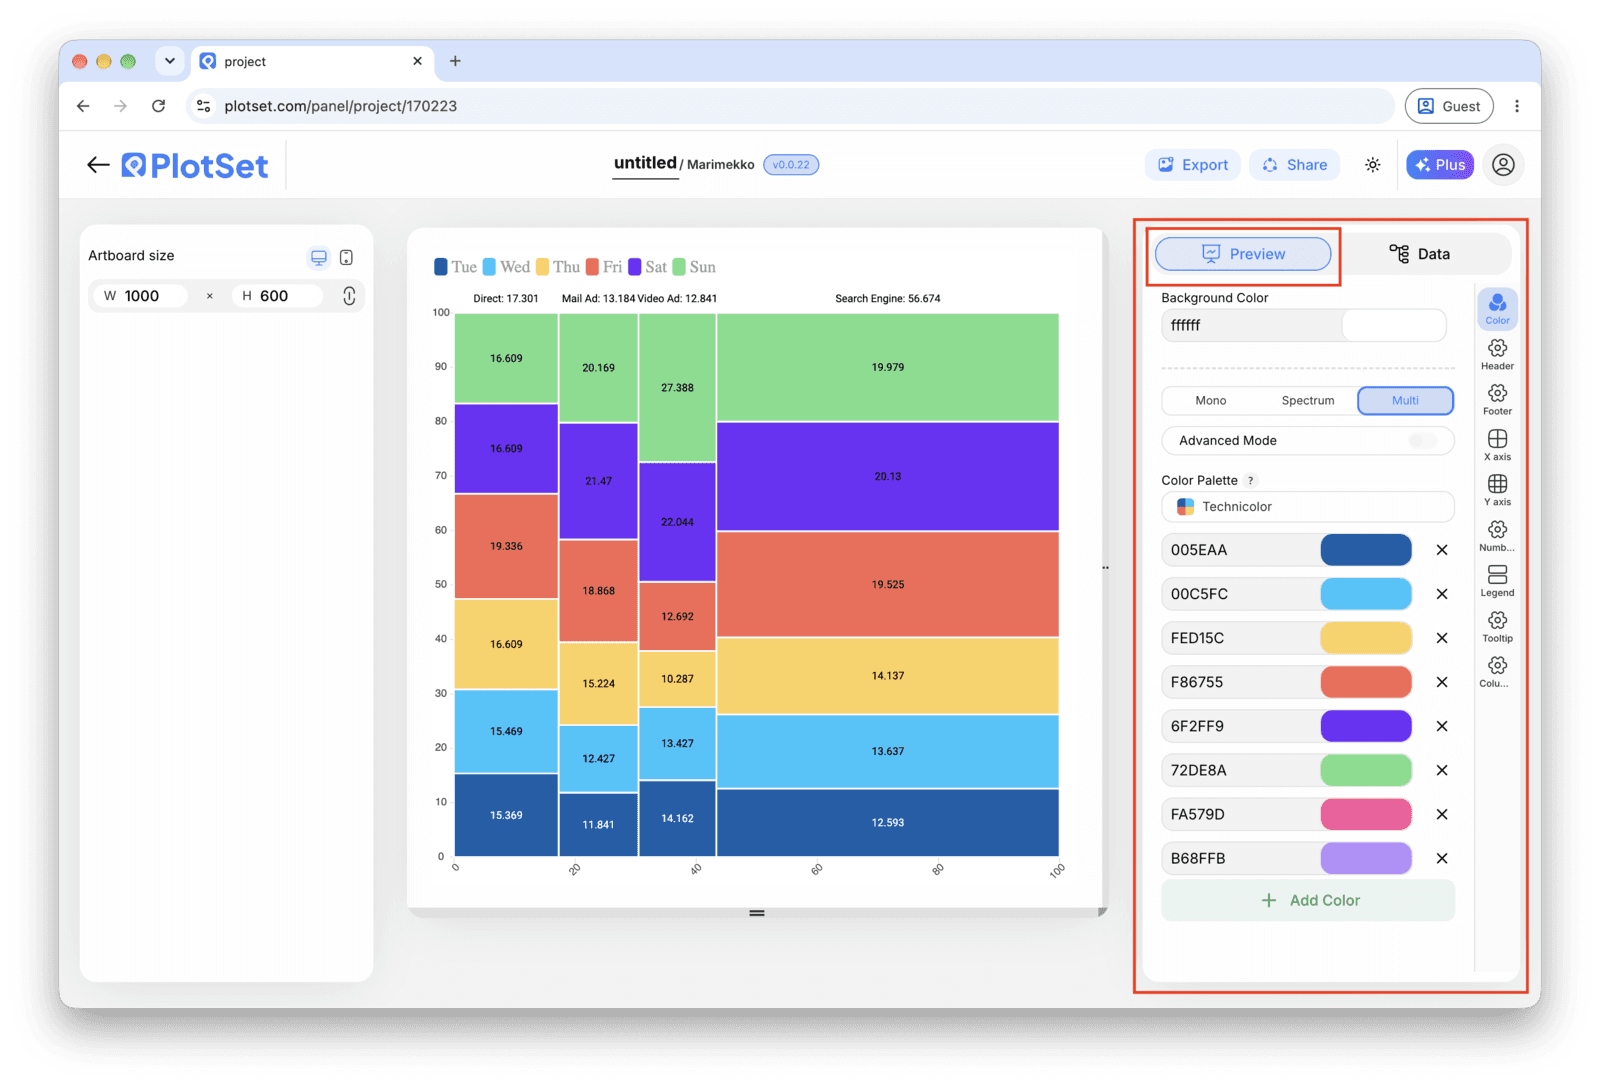
    L'éditeur PlotSet sur l'onglet 'Preview' : un graphique Marimekko Chart terminé sur le canevas, avec le panneau de réglages entouré en rouge le long du bord droit.
    L'onglet 'Preview' pour un graphique Marimekko Chart. Tous les réglages de style se trouvent dans le panneau entouré en rouge : apparence, en-tête, pied de page et les options propres à ce type de graphique, chacun dans un onglet distinct.
  8. 08

    Pick colors and publish, embed or export

    Assign one color per subdivision and keep that mapping constant across every column, the same way you kept the stacking order constant. Then publish for a live interactive chart with hover tooltips, grab the embed code for a page, or export a PNG, SVG or PDF for a deck.

Partez du modèle Marimekko Chart avec des données d'exemple déjà chargées, puis remplacez-les par les vôtres.

Ouvrir le modèle

Publier, intégrer ou exporter

La dernière ligne droite est la même pour tous les types de graphique : 'Share' transforme le graphique en lien public actif et en code d'intégration, 'Export' l'enregistre sous forme de fichier statique.

Share : lien public et code d'intégration

Activer le code d'intégration et le lien public revient à publier le graphique. Le lien peut être envoyé à qui vous voulez sans risque, et le code d'intégration s'insère dans n'importe quelle page sous la forme d'une iframe qui conserve les infobulles au survol et l'interactivité. Si vous modifiez le graphique par la suite, cliquez sur 'Recreate' pour répercuter ces changements sur le lien comme sur le code.

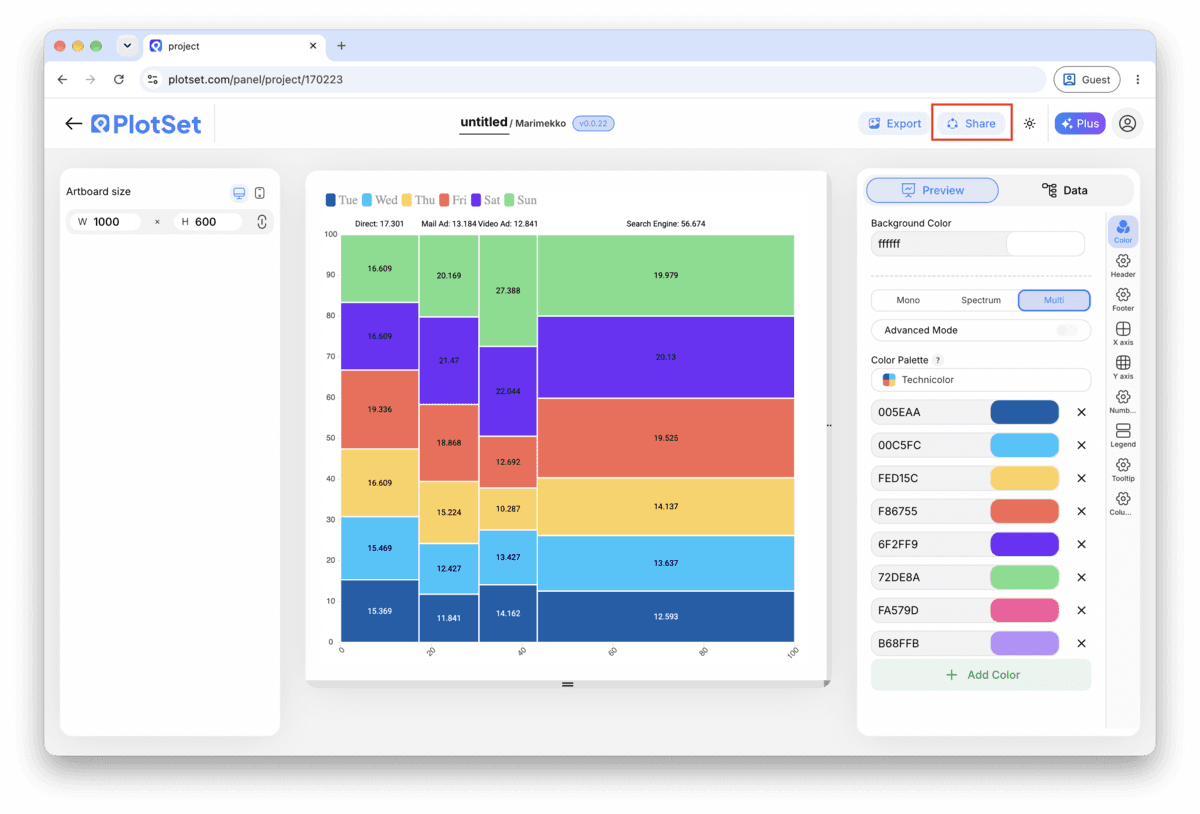
La barre d'outils de l'éditeur PlotSet avec le bouton 'Share' mis en évidence, juste à côté du bouton 'Export'.
C'est par 'Share' qu'un graphique terminé devient un lien public et un code d'intégration.
La fenêtre 'Share' de PlotSet : l'interrupteur qui active le code d'intégration et le lien public, les boutons 'Link', 'Embed', Facebook, Reddit, Twitter, LinkedIn et Email, et le lien public du graphique avec un bouton 'Copy'.
Activez le code d'intégration et le lien public, puis copiez le lien ou récupérez l'iframe. 'Recreate' répercute vos modifications ultérieures sur le lien et le code déjà partagés.

Export : SVG, PNG ou JPG

Le bouton 'Export' génère une copie statique à la taille dont vous avez besoin. Le SVG reste net à toutes les échelles et peut encore être modifié dans un outil de design ; PNG et JPG sont les choix sûrs pour les présentations et les documents. C'est le multiplicateur d'échelle qui vous donne une image nette sur un écran retina.

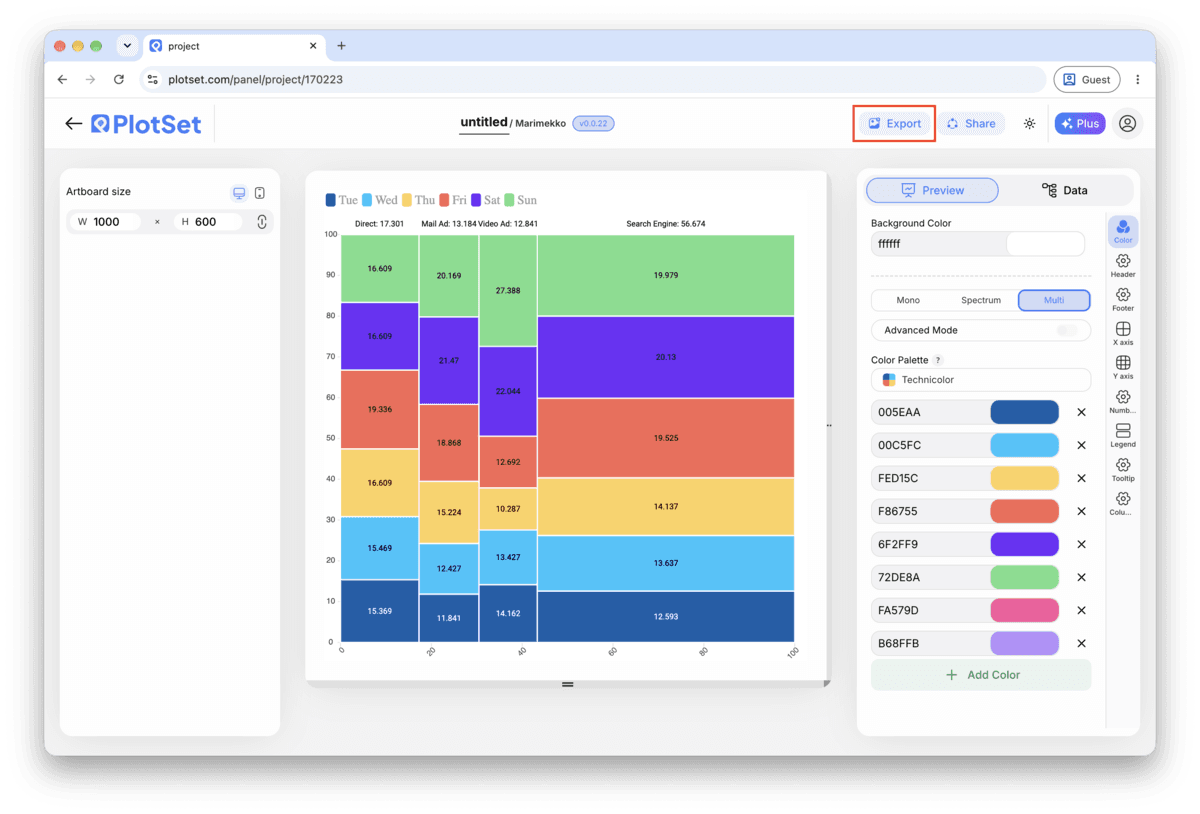
La barre d'outils de l'éditeur PlotSet avec le bouton 'Export' mis en évidence.
C'est par 'Export' que vous obtenez un fichier statique pour une diapositive ou un rapport.
La fenêtre 'Export chart' de PlotSet : un sélecteur d'échelle réglé sur 2x, les champs de largeur et de hauteur à 1000 × 600, et le menu des formats ouvert, affichant SVG, PNG et JPG.
Le SVG reste net à toutes les tailles et modifiable dans un outil de design ; PNG et JPG sont les choix sûrs pour une présentation. Réglez l'échelle avant d'exporter pour que l'image soit nette sur un écran retina.

Conseils de style pour un Marimekko Chart

Label the top axis, not just the blocks

The width of each column is half of what a Marimekko encodes, and it is the half readers miss most often. A cumulative scale along the top turns an implied comparison into one they can actually read.

Lock the subdivision order before you touch color

Set the stacking order once, confirm it holds across every column, and only then start assigning colors. Reordering after coloring means redoing the color mapping too.

Group anything under about five percent into Other

A subdivision too small to get its own labeled sliver just clutters the chart. Fold it into a named Other block per column rather than leaving a row of unreadable slivers.

Keep it to a handful of segments and stacks

Six columns and five stacks is already a lot to compare by area. Past that, filter to the segments that matter (top regions, top categories) and say so in the title or a caption.

Erreurs courantes en créant un Marimekko Chart

Every column comes out the same width

This usually means the value column uploaded as text rather than a number, or two rows spelled the segment name differently ("APAC" versus "Asia Pacific") so PlotSet cannot sum them into one segment total. Fix the spelling or the number format in the source sheet and re-upload.

The stacking order flips between columns

Each column is sorting its subdivisions independently, usually by value, instead of using one fixed order. Set the subdivision order explicitly in the chart settings rather than leaving it on automatic, and it will hold across every column.

Blocks are too thin to label

Too many segments, too many subdivisions, or both. Filter the segments to the ones carrying the story and fold small subdivisions into an Other block before uploading again.

En savoir plus sur le Marimekko Chart

Vous n'êtes pas sûr que le Marimekko Chart soit le bon choix ? Découvrez ce que c'est, quand l'utiliser et quand l'éviter.

À propos du Marimekko Chart

Marimekko Chart : questions fréquentes

Three: a segment (the column), a subdivision (the stack inside it), and a value. One row per segment-subdivision pair, in long format. PlotSet calculates each column's width from the segment totals, so you never enter a width directly.

Créez votre Marimekko Chart maintenant

Gratuit pour commencer avec plus de 300 modèles. Aucune carte bancaire requise.