PlotSet LogoPlotSet
Modèles

Graphique en aires

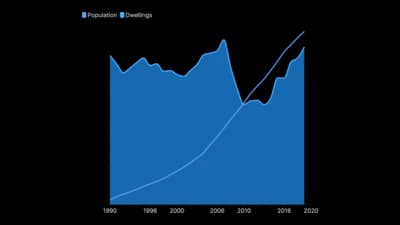
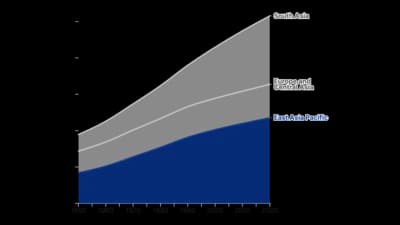
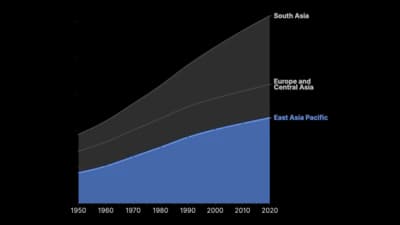
Des lignes remplies qui montrent comment une quantité croît et décroît dans le temps.

Modèles

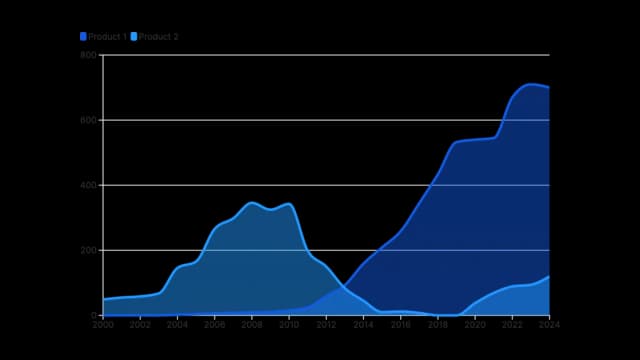
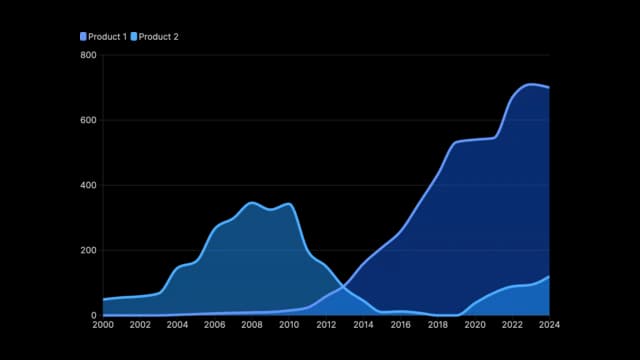
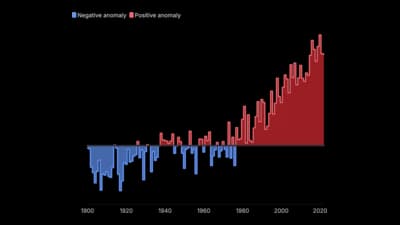
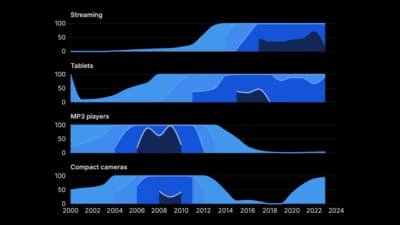
Partez de l’un de ces modèles et remplacez les données par les vôtres.

Qu’est-ce qu’un Graphique en aires ?

An area chart is a line chart with the space between the line and the baseline filled in. That fill changes what the chart is about: a line asks you to follow a rate, an area asks you to see an accumulated quantity. Stack several series and the filled bands show both the total and each part's contribution to it over time, which is why area charts are the standard way to draw energy mixes, revenue by segment and traffic by channel. The fill is also the risk, because it makes the chart look like it is about magnitude even when the axis has been cut.

Quand utiliser un Graphique en aires

  • The quantity is a volume, not a rate

    Total users, cumulative revenue, energy generated. If summing the area under the curve would mean something, filling it in is honest.

  • You are showing a composition changing over time

    Stacked areas show the total and its parts at once. Watching one band swell while another shrinks is the clearest way to draw a shift in mix.

  • There is one series and you want emphasis

    A single filled area reads as more substantial than a bare line. On a dashboard where one number is the headline, that weight is useful.

  • Time is continuous and evenly spaced

    Areas imply that values flow into each other between the points. That is only true when the x-axis is genuinely continuous.

Quand éviter un Graphique en aires

  • You need to compare individual series precisely

    In a stacked area chart only the bottom band sits on a flat baseline. Every band above it is read against a wavy line, which the eye does badly. Use lines.

  • The series overlap and cross

    Unstacked areas hide each other. Two or three with heavy transparency is the limit before the chart becomes a colour smear.

  • Any value can be negative

    Stacking breaks down as soon as a series goes below zero, and the totals stop meaning anything.

  • The baseline is not zero

    The fill is the whole point of an area chart, and a truncated axis fills in an area that does not exist. If you need a cut axis, draw a line chart.

Comment créer un Graphique en aires

D’un tableur à un graphique publié, étape par étape.

  1. 01Start from the area chart template
  2. 02Shape your data with time in the first column
  3. 03Upload or connect your data
  4. 04Decide stacked, percentage or overlapping
  5. 05Publish, embed or export

Les éléments d’un Graphique en aires

Band
One series, drawn as a filled region. In a stacked chart its thickness at any point is that series' value, not its position on the axis.
Baseline
Zero, and it has to be. The filled area is measured from here, so moving it silently rescales the whole chart.
Stacking order
Which series sits at the bottom. The bottom band is the only one that can be read accurately, so put the series you most want understood there.
Boundary line
The top edge of a band. In a stacked chart the topmost boundary is the total, which is often the most useful line on the chart.
Fill opacity
Matters only for overlapping areas. Below about 60% opacity the colours mix into shades that belong to no series.
Percentage mode
Rescales every period to 100%. Shows the changing mix clearly, and completely hides whether the underlying total grew or collapsed.

Erreurs courantes avec un Graphique en aires

Stacking too many series

Past four or five bands, the ones in the middle are thin, wavy and unreadable. Group the small series into an "other" band and name it.

Reading a middle band as a trend

A band can look like it is rising when it is merely being pushed up by the one below. Say explicitly that thickness, not height, is the value.

Using percentage mode without saying so

A 100% stacked area looks stable even if the business halved. Label the axis and the caption so the reader knows the total has been removed.

Filling under a rate

The area under a percentage or a price means nothing. If summing it would be nonsense, use a line chart.

Graphique en aires : questions fréquentes

Showing how a quantity changes over time, with the volume beneath the line filled in. Stacked versions show how a total is composed and how that composition shifts.

Créez votre Graphique en aires maintenant

Gratuit pour commencer, avec plus de 600 modèles. Sans carte bancaire.