
Colorear cada región
La intensidad del color transporta el valor. La opción correcta para tasas, porcentajes y cifras per cápita, ya ajustadas al tamaño o la población.
Abrir la plantillaA blank county map to print, and a builder to fill it with your own data. Download the free outline of all 3,000-plus US counties, or upload a spreadsheet and publish an interactive county map you can embed anywhere.
Los 3136 counties, con un trazado limpio. Imprímelo, coloréalo o insértalo en un documento — sin cuenta y sin atribución.
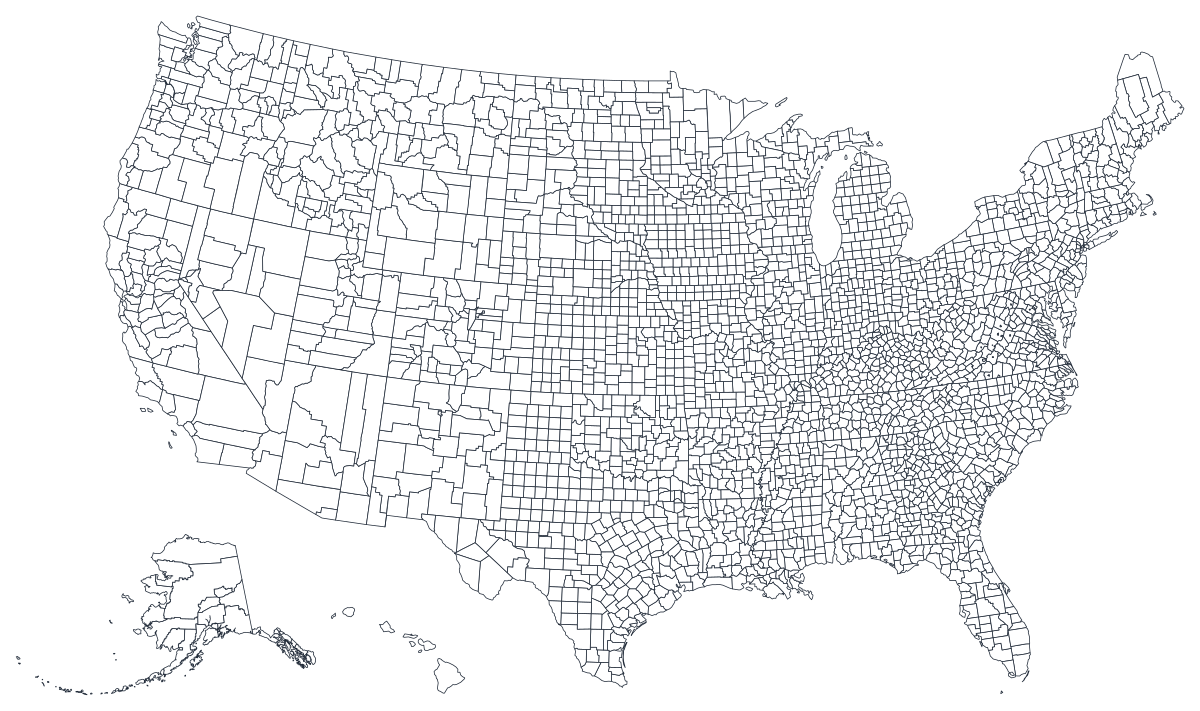
Libre para cualquier uso, incluidos el comercial y el educativo. Generado a partir de los mismos límites que usa el editor.
Descargar SVGThe county is the smallest geography most American data is published at, and the one where national averages finally break apart into something recognisable. A state-level map of the United States has fifty shapes and tends to show you politics; the same measure drawn across 3,100 counties shows you the Black Belt, the Rio Grande valley, the Appalachian coalfields and the ring of suburbs around every large city. That resolution is the reason to use this map — and also the reason to be careful with it, because counties vary enormously in population and a county map gives every one of them the same visual weight as the land it occupies.
Colorea las regiones cuando tu cifra es una tasa; dimensiona un marcador cuando es un recuento. Invertirlo es la forma más común de que un mapa engañe.
La intensidad del color transporta el valor. La opción correcta para tasas, porcentajes y cifras per cápita, ya ajustadas al tamaño o la población.
Abrir la plantillaUn símbolo por región, escalado según el valor. Úsalo para recuentos y totales, donde colorear la superficie solo redibujaría el mapa de población.
Abrir la plantillaCírculos dimensionados por el valor sobre el contorno. Funciona bien cuando unas pocas regiones dominan y las pequeñas se perderían en un color.
Abrir la plantillaCensus tables, CDC and BLS releases, election returns and most state agency data all key on county. If your spreadsheet has a FIPS column, this is the map it was made for.
Almost every interesting geographic story in the United States is sub-state. Counties are where an urban/rural split, a border effect or a river valley becomes visible.
Unemployment rates, vaccination shares, median income, turnout percentage. Rates are already adjusted for size, which is exactly what a choropleth needs.
Classroom worksheets, planning sessions and colour-by-hand exercises. The blank outline above is free to download, print and reuse.
Shading counties by total cases or total sales just redraws the population map: Los Angeles County will always be dark. Use a symbol or bubble map, where the circle is sized by the count and the land area stops competing with it.
Counties and metro areas are not the same shape, and in New England they barely relate. If the unit you actually mean is a metro, a point map of cities carries it better.
Rates computed from a handful of events swing wildly in low-population counties, and a county map will show that noise as a bold pattern across the empty middle of the country. Aggregate up, or use a multi-year average.
Do not spread a state figure across its counties to fill the map. Use the US states map instead and say what you actually know.
De la hoja de cálculo al mapa publicado, paso a paso.
The free outline above is a plain SVG — print it, or drop it into a document. To build with data, open the PlotSet USA (counties) template, which comes with sample data already bound.
Five-digit county FIPS codes are the reliable join. County names repeat across states — there are more than thirty Washington Counties — so names alone will silently mismatch.
Import a CSV or Excel file, paste from a spreadsheet, or connect a Google Sheet so the map can be refreshed when the source updates.
Shade the counties for a rate, or switch to symbols or bubbles for a count. It is the same map and the same data; only the encoding changes.
Sequential for a measure that runs low to high, diverging only when there is a real midpoint — a national average, zero change, a 50 per cent line. Stepped scales read more precisely than a continuous gradient at this many regions.
Publish for a live interactive map with hover tooltips on every county, or export a PNG, SVG or PDF for a report.
Empieza con la plantilla de US counties y sus datos de ejemplo, y luego sustitúyelos por los tuyos.
Abrir la plantillaCómo debe ser la columna de lugares y dónde encontrar datos que ya coincidan.
The first two digits are the state, the last three the county. Keep it as text: Alabama's counties start 01 and a spreadsheet will happily strip that leading zero and turn 01001 into 1001.
Louisiana has parishes, Alaska has boroughs and census areas, and several states contain independent cities that are counted as county equivalents. All of them are in this map and all of them need a row.
Connecticut replaced its counties with planning regions in 2022 and Alaska redraws boroughs from time to time. If a handful of regions come out blank, a boundary vintage mismatch is usually why.
The Census Bureau's American Community Survey, the CDC's WONDER and PLACES releases, BLS local area unemployment statistics and the USDA's county-level economic data all publish with FIPS codes included.
The most common county-map error, and the one that turns every map into a population map. If the number gets bigger simply because more people live there, size a symbol by it rather than shading the county.
Names are not unique and are not spelled consistently — St. Louis city and St. Louis County, De Kalb and DeKalb, Doña Ana with and without its tilde. Use FIPS.
The largest counties in the west hold the fewest people, and on a choropleth they shout. Say so in the caption, or pair the map with a bar chart of the top counties by population.
Nobody can distinguish nine shades of blue across 3,100 small shapes. Five or six steps is the practical ceiling, and four is often clearer.
Yes. The outline above is a free SVG covering every US county — right-click to save it, print it, or drop it into a document or worksheet. No account needed.
Sube una hoja de cálculo y publica un mapa interactivo en un par de minutos — gratis y sin tarjeta.